aorta
Profiling Guide
This guide covers how to capture, analyze, and interpret profiling data from AORTA benchmark runs.
Start here: the profiling collectors
For new work, use the rocprof and proton collectors — the supported,
first-class way to attach a GPU profiler to anything aorta runs:
aorta sweep run --recipe <recipe>.yaml --collect rocprof -- <your command>
They attach by wrapping the launch argv, so no payload edit is needed; they
write artifacts next to the trial JSON; and they parse themselves into
rocprof_gpu_time_ms / proton_gpu_time_ms and friends, which show up in
perf.md and matrix.json for every cell of a sweep.
Full reference — options, artifact layout, analysis recipes, troubleshooting:
Profiling Collectors. Runnable examples:
examples/profiling/.
Proton has five backends and they do not measure the same thing — whole-kernel timing, intra-kernel cycle counts and PC sampling are three different questions, and one of them publishes no numeric metrics at all. If you are deciding which to use, start at Choosing a Proton backend.
The rest of this guide covers two other things: the benchmark harness’s own
built-in telemetry (below), which is independent of the collectors, and the
older hand-rolled rocprofv3 capture scripts, which are kept working but are
no longer the recommended route.
Profiling Outputs
Each rank writes artifacts/rank_<rank>_metrics.jsonl containing iteration-level telemetry:
- Per-stream durations (ms) for compute, all-reduce, reduce-scatter, and auxiliary streams
- Overlap segments with concurrency statistics and utilisation ratios
- ROCm diagnostic output when enabled (rank-local)
- Loss, learning rate, gradient norms, and global step counters
Events are captured using torch.cuda.Event(enable_timing=True) for microsecond fidelity. Distributed collectives are monkey-patched at runtime so that all-reduce and reduce-scatter operations execute on dedicated streams and contribute to overlap calculation.
Torch Profiler Traces
Enable PyTorch’s profiler by toggling the profiling block in your config or via CLI override:
torchrun --nproc_per_node 4 train.py \
  --config config/default.yaml \
  --override profiling.enabled=true \
  --override profiling.wait=1 \
  --override profiling.warmup=1 \
  --override profiling.active=2
Output Locations
- TensorBoard traces write to
artifacts/torch_profiler/rank*/by default - Launch
tensorboard --logdir artifacts/torch_profilerand use the Profile tab for stream timelines
Chrome Traces
- Enable via
profiling.chrome_trace=true - Not recommended on ROCm - the toolkit disables them automatically to avoid known Kineto crashes
- Adjust
wait,warmup,active, andrepeatto control capture cadence - Shapes and memory statistics are recorded by default
ROCm rocprofv3 Capture (manual / legacy)
Legacy route. These scripts predate the
rocprofcollector and are kept for reproducing existing captures. They hard-code this repo’strain.pylaunch, write outside the sweep results tree, and parse nothing — so their numbers do not reachperf.mdormatrix.json. For new work prefer--collect rocprof(Profiling Collectors), which profiles any command a sweep runs as a subprocess and lands its artifacts and metrics in the trial tree.
Single-node: scripts/rocprof_capture.sh
Use the wrapper script to profile an entire ROCm run:
bash scripts/rocprof_capture.sh config/default.yaml --override training.max_steps=50
Output Location
Outputs land under rocprof_traces/run_<timestamp>/.
Environment Variables
Override location or extra flags with environment variables:
ROCPROF_OUTPUT_DIR=/path/to/outROCPROF_ARGS="--att --kernel-trace --kernel-symbols"
The script mirrors launch_rocm.sh but executes through rocprofv3, so you can merge traces with the JSONL metrics using the shared iteration timestamps.
Multi-node: scripts/multi_node/local_launch.sh
The multi-node launcher has its own opt-in rocprofv3 path, driven by
positional arguments rather than environment variables: pass ENABLE_ROCPROF
as true, optionally followed by ROCPROF_STATS (true adds --stats) and
ROCPROF_INPUT (a rocprofv3 -i input file, e.g.
scripts/gemm_analysis/rocprof_input.yaml). When enabled it runs the
in-container training command under rocprofv3 and writes to
<experiment_dir>/<threads>thread_<channels>channels/rocprof_traces/node_<rank>/.
Same caveat as above: a manual capture route tied to this launcher, with no
parsing and no metrics.
Generating Reports
Run the analyser to build summaries and plots from one or more log directories:
python analysis/overlap_report.py \
  --log-dir artifacts_rocm --label rocm \
  --log-dir artifacts_cuda --label cuda \
  --output reports/2024-roc-vs-cuda \
  --reference cuda --candidate rocm
Report Outputs
summary.json- Aggregate metrics per dataset plus comparative ratios{label}_timeline.png- Overlays showing compute and overlap durations per global step
Use these artefacts to pinpoint scheduling or synchronisation regressions between hardware backends.
Diagnostic Insights
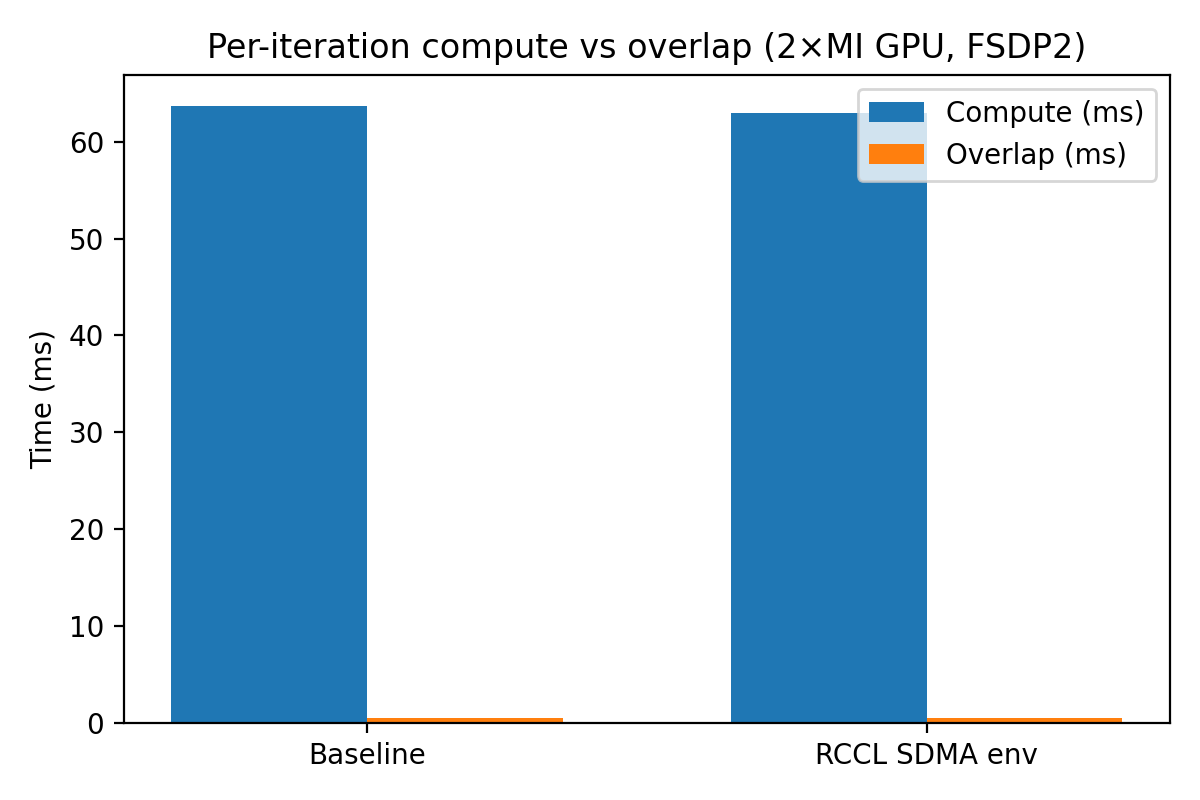
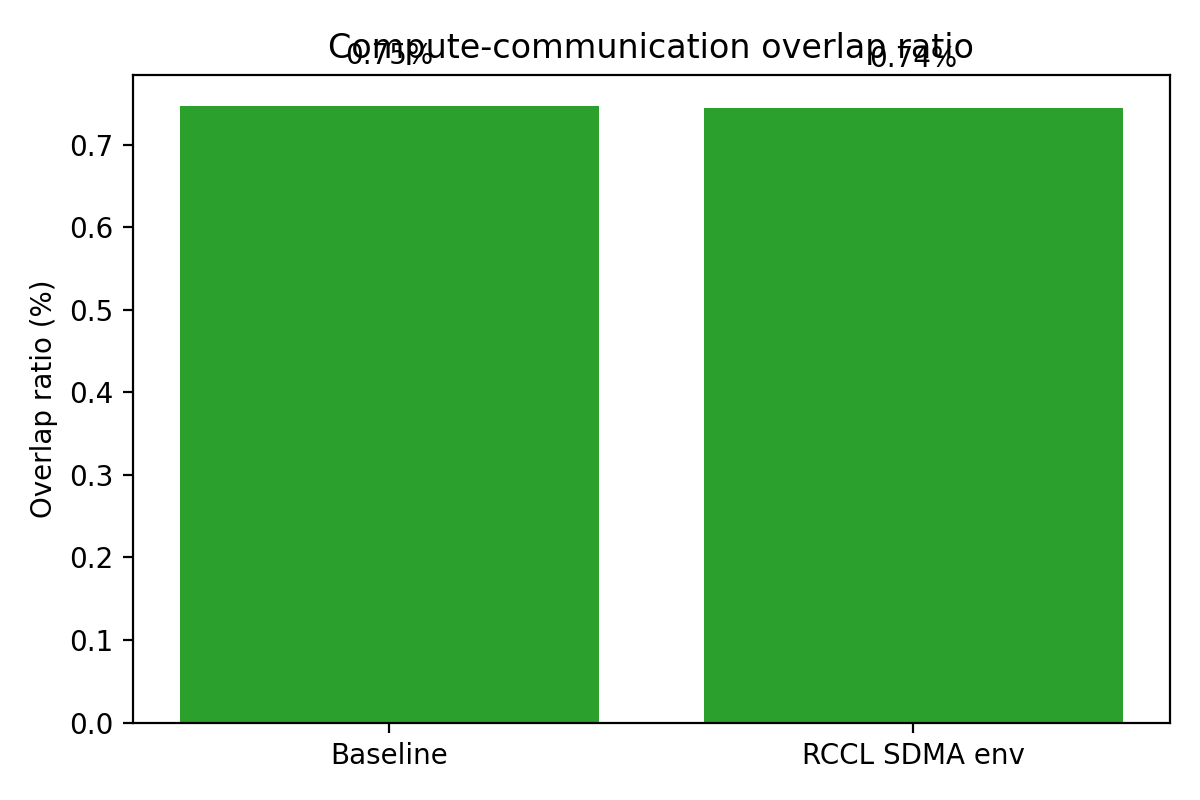
Key Metrics
| Metric | Interpretation |
|---|---|
Overlap Ratio (overlap_ratio) |
Values close to 1 indicate strong overlap; values near 0 imply communications block compute |
Compute All-Reduce (compute_allreduce_ms) |
Time spent in all-reduce operations |
Compute Reduce-Scatter (compute_reducescatter_ms) |
Time spent in reduce-scatter operations |
Analysis Tips
- Compare
compute_allreduce_msvscompute_reducescatter_msto determine which collective dominates stall time - Inspect
active_segmentsin the JSONL logs to align iteration windows with external profilers (e.g., ROCm tracer) - Cross-reference
rocm_smi_outputagainst overlap dips to correlate DVFS throttling or memory pressure with scheduling gaps
Advanced Profiling
For deeper inspection, combine these scripts with nsys, rocprof, or PyTorch profiler traces using the iteration timestamps documented in the JSON traces.
Next Steps
- Profiling Collectors -
--collect rocprof/--collect proton: the supported way to profile any command aorta runs - eBPF Usage Guide - Kernel-level GPU queue and memory tracing with eBPF
- Troubleshooting - Common issues and solutions
- Configuration Guide - Tune parameters for better overlap