Grafana Dashboards
Dashboards allow cluster telemetry data to be visualized interactively in near real-time. Omnistat provides several sample Grafana dashboards for cluster-wide deployments that vary depending on whether resource manager integration is desired or not (screenshots of the variants with resource manager integration enabled are highlighted in Example Screenshots). JSON sources for example dashboards that can be used in local deployments are highlighted below.
RMS dashboards provide integration with Resource Managers like SLURM.
Global Dashboard: provides an overview of the system, cluster-level telemetry for allocated and unallocated nodes, RAS counters, and job indices.
Node Dashboard: job allocation timeline and detailed metrics for a single node in the cluster.
Job Dashboard: provides detailed time-series data, load distribution, and other metrics for a single job.
Standalone dashboards are meant to work without a resource manager.
Global Dashboard: provides an overview of the system, cluster-level telemetry, and RAS counters.
Node Dashboard: detailed metrics for a single node in the cluster.
Grafana server
To visualize Omnistat’s monitoring data, Grafana needs to be installed and configured to use the Prometheus server described in the system-wide installation.
Installation
The official Grafana documentation describes several ways to install Grafana, including using packages for major operating systems.
Connectivity between Grafana server and Prometheus server is required to display Omnistat data, so Grafana is typically installed and runs on an administrative host. If the host chosen to support the Prometheus server can route out externally, you can also leverage public Grafana Cloud infrastructure and forward system telemetry data to an external Grafana instance.
Note
We recommend the official documentation for production systems. However, if you are only interested in testing the dashboards, you can use the Grafana Docker image. For example, run a temporary Grafana container with the following command, load localhost:3000 in a browser, and then follow the steps below to configure the Grafana server and import dashboards.
docker run -e GF_AUTH_ANONYMOUS_ENABLED=true -e GF_AUTH_ANONYMOUS_ORG_ROLE=Admin -e GF_USERS_DEFAULT_THEME=light -it --rm -p 3000:3000 grafana/grafana
Data source
The Prometheus server configured as part of the Omnistat installation needs to be added to Grafana as a new data source.
To add a data source to Grafana:
Click Connections in the left-side menu.
Enter “Prometheus” in the search dialog, and click the Prometheus button under the search box.
Configure the new Prometehus data source following instructions and provide the hostname and port where Omnistat’s Prometheus server is running.
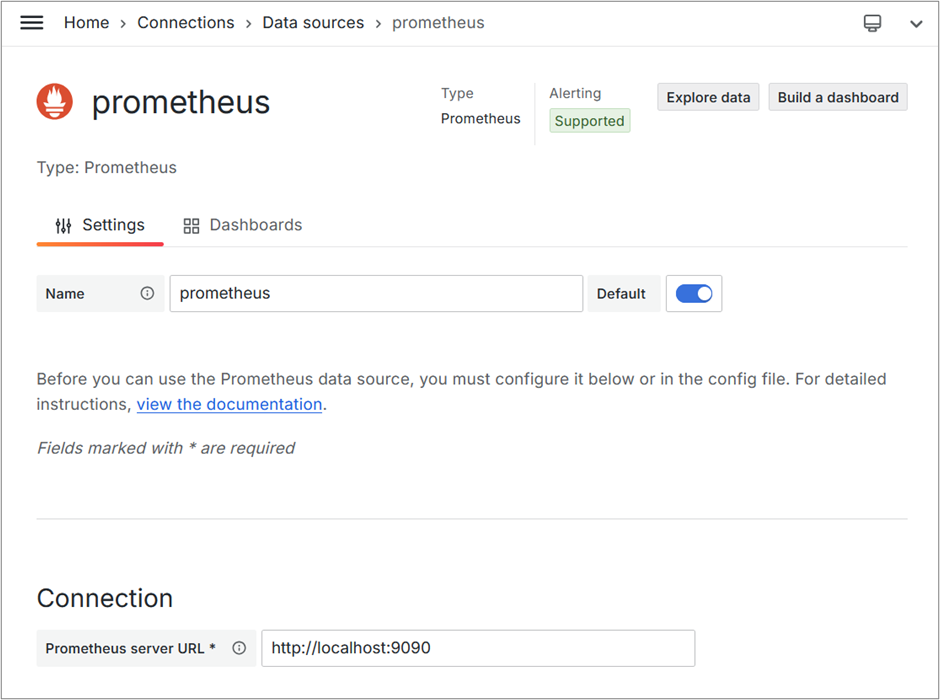
Figure 3 Adding a data source in Grafana
Import dashboards
To import a dashboard to an existing Grafana server:
Click Dashboards in the left-side menu.
Click New and select New Dashboard from the drop-down menu.
On the dashboard, click + Add visualization.
Upload the dashboard JSON file.
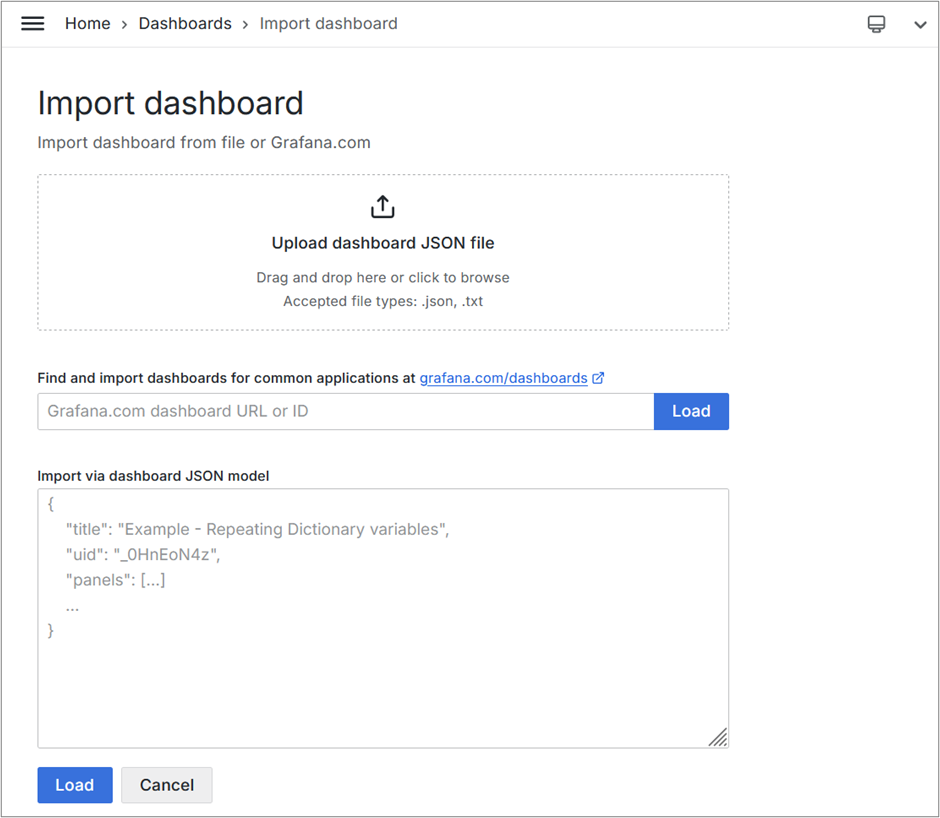
Figure 4 Importing a dashboard in Grafana
Sample dashboards are configured using standard default values for settings such as network ports, but may require changes depending on the environment. The following variable is the most relevant dashboard setting that may require changes:
source: Name of the Prometheus data source where the data is stored. Defaults toprometheus, and may require filtering if the Grafana instance has several Prometheus data sources.
To configure a dashboard:
Open a dashboard in edit mode.
Click Dashboard settings located at the top of the page.
Click Variables.
Click the desired variable and update its value.
Example screenshots
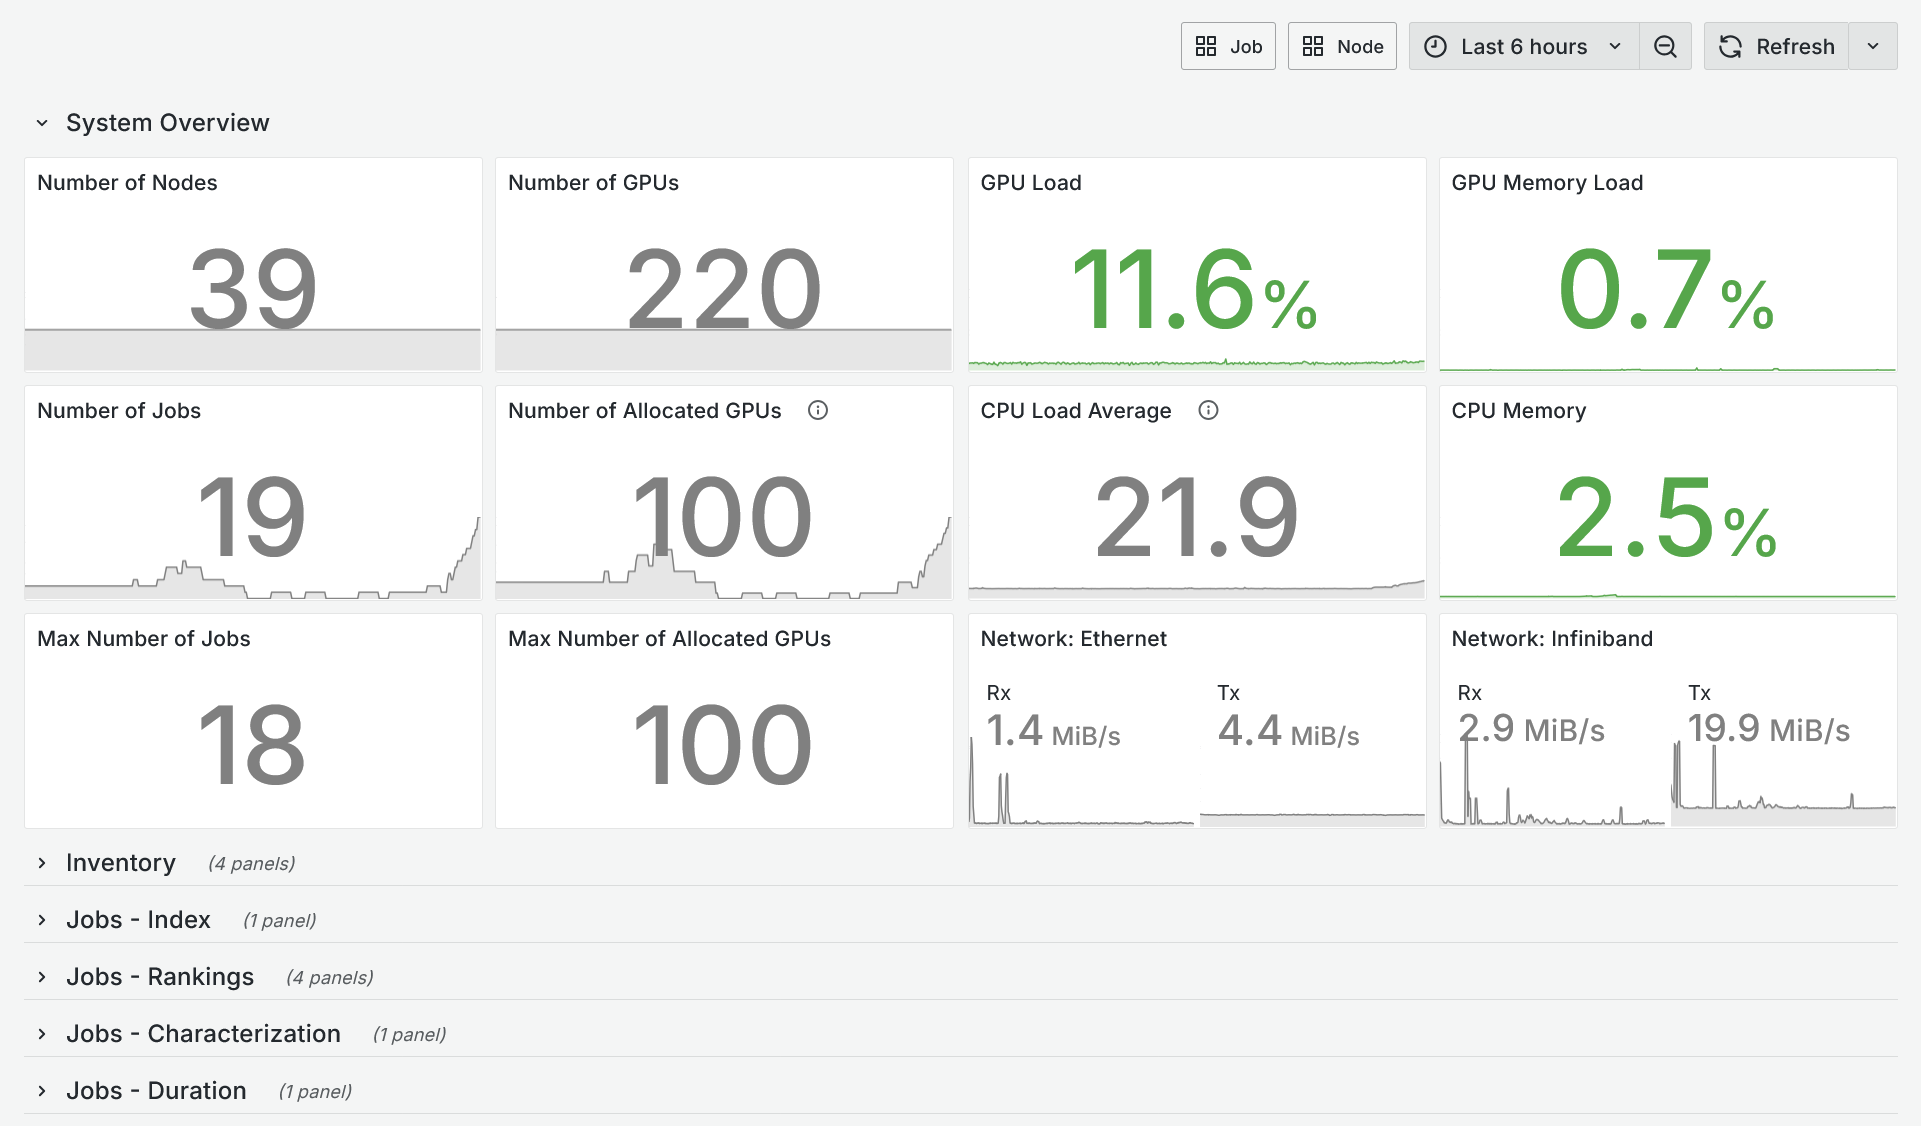
Figure 5 Global dashboard screenshot
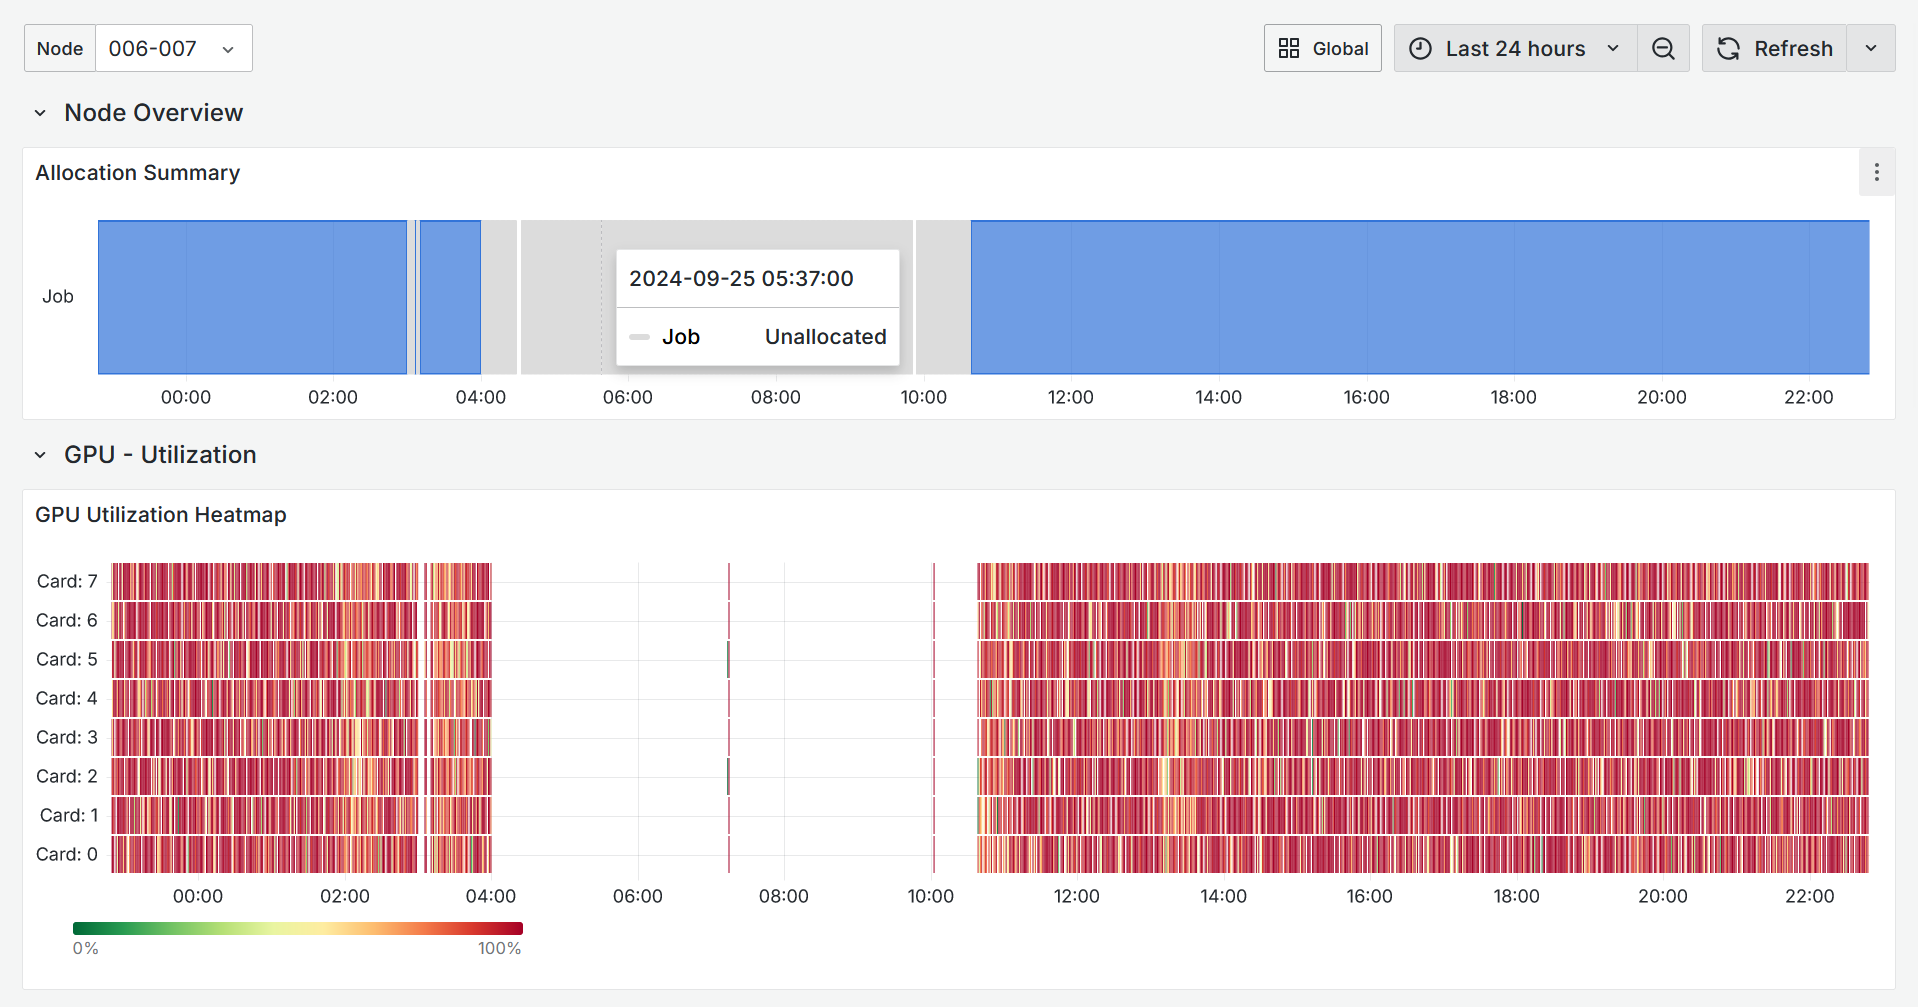
Figure 6 Node dashboard screenshot
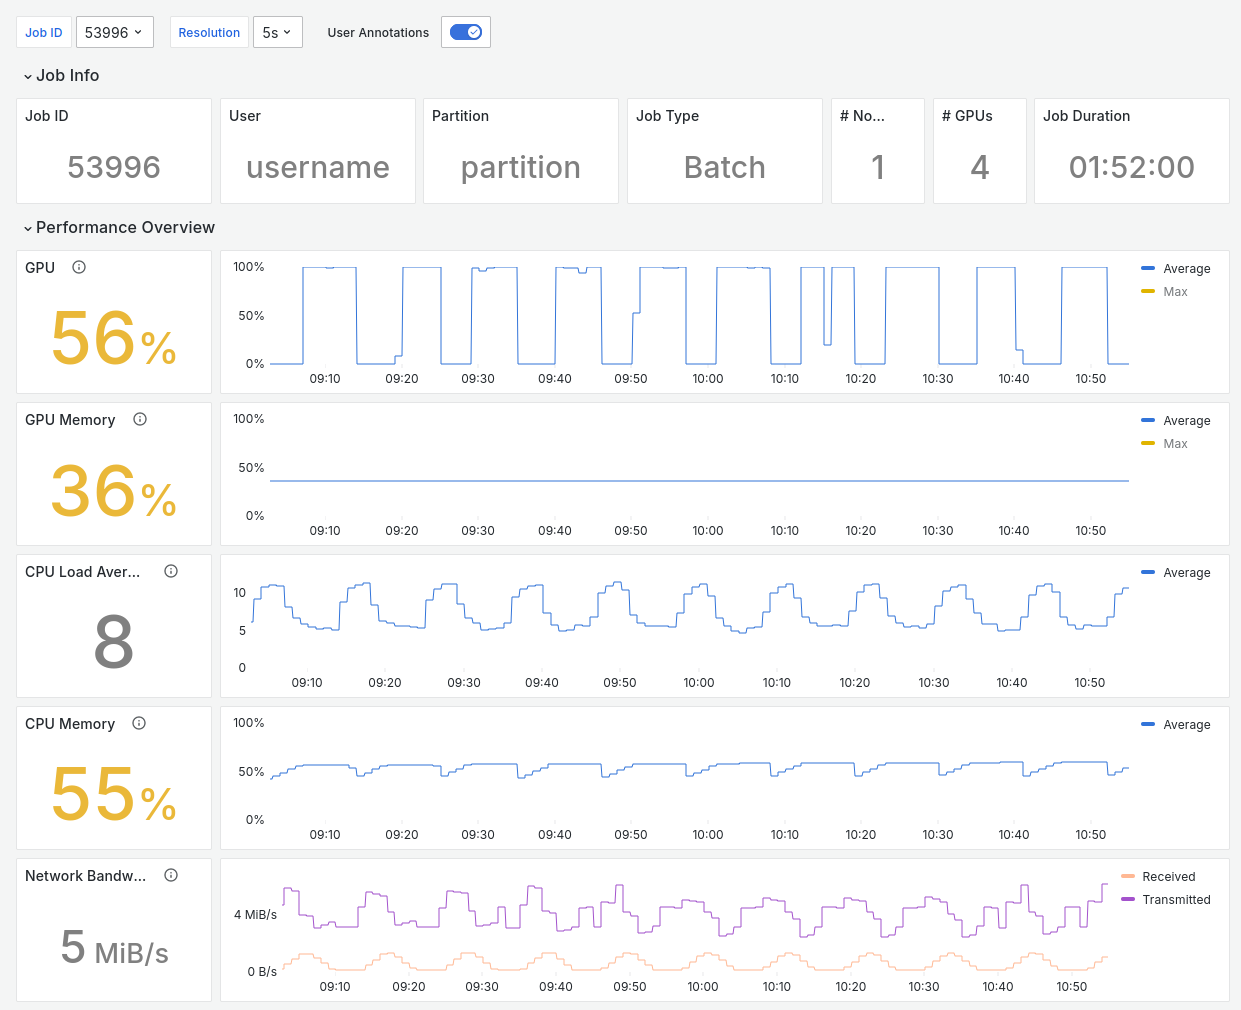
Figure 7 Job dashboard screenshot
Cluster Rack View
In addition to the pre-configured Grafana panels highlighted above, additional utilities are provided to generate a custom Grafana dashboard that renders a physical rack-layout view for visualizing a subset of Omnistat metrics. Each rack is drawn as a vertical column with compute servers color-coded by metric value (e.g., temperature, utilization, power) and users can specify rack sizes, locations, and include additional switch locations to match their local installation.
YAML Configuration
The desired cluster layout is defined in a YAML configuration file, and a companion Python generator script produces the Grafana dashboard JSON for import. To illustrate the configuration options, a simple two-rack example with different server types is provided in example_cluster.yaml.
The top-level fields are:
Field |
Description |
|---|---|
|
Short identifier used in the dashboard title and UID |
|
Human-readable name shown in the dashboard header |
|
Omnistat exporter port (default: 8000) |
|
Base URL of the Grafana instance (e.g., |
|
URL path to a per-node dashboard; |
|
List of Prometheus metrics to visualize, each with |
|
List of rack definitions |
Each entry in racks contains:
Field |
Description |
|---|---|
|
Unique rack identifier |
|
Display label shown above the rack |
|
Column position (1-indexed, left to right) |
|
Total rack height in rack units |
|
List of server entries occupying the rack |
Each entry in servers supports the following types:
compute— GPU-equipped server. Requireshostnameandgpu_count, or avmslist for servers with individually-addressable GPUs. Each GPU is rendered as a color-coded box bound to the corresponding Prometheus metric field.storage— Rendered as a solid block with a text label; no GPU metrics.network— Rendered as a solid block with a text label; no GPU metrics.
Unoccupied rack unit slots are automatically filled with blank panels.
Generating the Dashboard
The cluster dashboard generator utility is located at misc/cluster_dashboard/generate_cluster_dashboard.py within the Omnistat repository. The generator script requires Python 3 and additional dependencies outlined in misc/cluster_dashboard/requirements.txt.
The following commands highlight basic usage. Note that a --preview option exists to generate a static preview (SVG format) allowing administrators to iterate on the configuration before importing a final version into Grafana. An example preview rendering for the example cluster definition is shown in Figure 8.
# Generate a Grafana dashboard JSON file
python3 generate_cluster_dashboard.py example_cluster.yaml -o dashboard.json

# Optionally generate a static SVG preview
python3 generate_cluster_dashboard.py example_cluster.yaml -o dashboard.json --preview
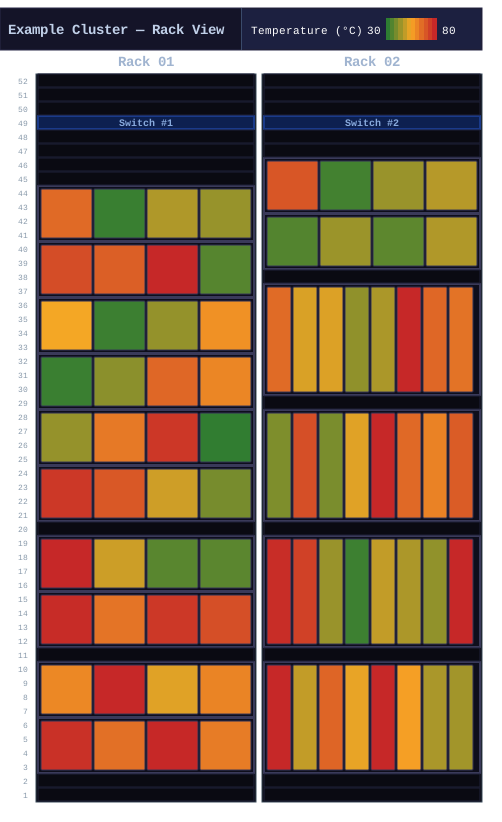
Figure 8 Static SVG preview generated from the example cluster configuration
Importing into Grafana
Import the generated JSON file into Grafana following the steps described in Import dashboards above. The dashboard will display with one tab per configured metric with GPUs in each server color-coded based on linked Omnistat telemetry data. Hover over a specific GPU to see exact values and link to the associated node dashboard.
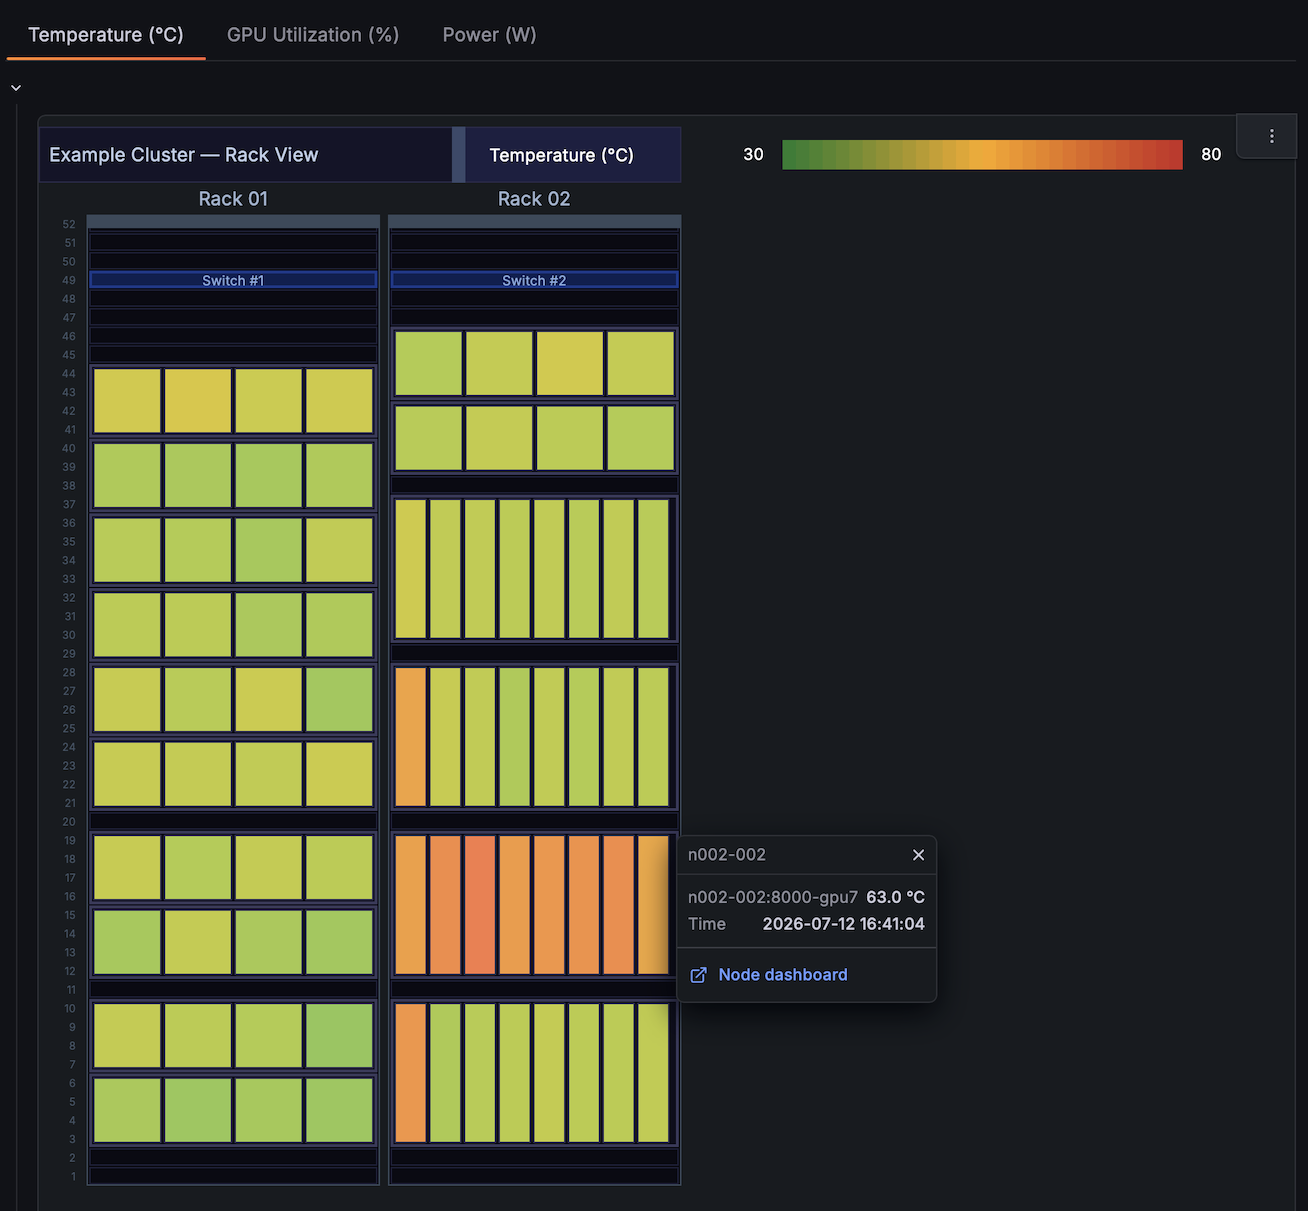
Figure 9 Live cluster rack example rendering in Grafana