Causal Profiling
What is “Causal Profiling”?
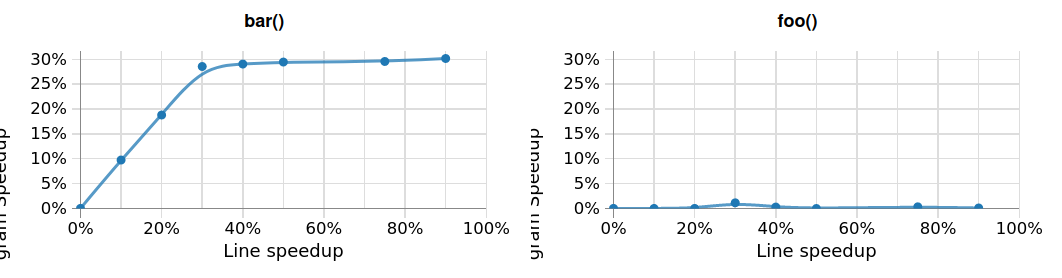
If you speed up a given block of code by X%, the application will execute Y% faster
Causal profiling directs parallel application developers to where they should focus their optimization efforts by quantifying the potential impact of optimizations. Causal profiling is rooted in the concept that software execution speed is relative: speeding up a block of code by X% is mathematically equivalent to that block of code running at its current speed if all the other code running slower by X%. Thus, causal profiling works by performing experiments on blocks of code during program execution which insert pauses to slow down all other concurrently running code. During post-processing, these experiments are translated into calculations for the potential impact of speeding up this block of code.
Consider the following C++ code executing foo and bar concurrently in two different threads
where foo is 30% faster than bar (ideally):
#include <cstddef>
#include <thread>
constexpr size_t FOO_N =  7 * 1000000000UL;
constexpr size_t BAR_N = 10 * 1000000000UL;

void foo()
{
    for(volatile size_t i = 0; i < FOO_N; ++i) {}
}

void bar()
{
    for(volatile size_t i = 0; i < BAR_N; ++i) {}
}

int main()
{
    std::thread _threads[] = { std::thread{ foo },
                      std::thread{ bar } };

    for(auto& itr : _threads)
        itr.join();
}
No matter how many optimizations are applied to foo, the application will always require the same amount of time
because the end-to-end performance is limited by bar. However, a 5% speedup in bar will result in the
end-to-end performance improving by 5% and this trend will continue linearly (10% speedup in bar yields 10% speedup in
end-to-end performance, and so on) up to 30% speedup, at which point, bar executes as fast as foo;
any speedup to bar beyond 30% will still only yield an end-to-end performance speedup of 30% since the application
will be limited by performance of foo, as demonstrated below in the causal profiling visualization:
The full details of the causal profiling methodology can be found in the paper Coz: Finding Code that Counts with Causal Profiling. The author’s implementation is publicly available on GitHub.
Getting Started
Progress Points
Causal profiling requires “progress points” to track progress through the code in between samples. Progress points must be triggered deterministically via instrumentation. This can happen in three different ways:
OmniTrace can leverage the callbacks from Kokkos-Tools, OpenMP-Tools, roctracer, etc. and the wrappers around functions for MPI, NUMA, RCCL, etc. to act as progress-points
User can leverage the runtime instrumentation capabilities to insert progress-points (NOTE: binary rewrite to insert progress-points is not supported)
User can leverage the User API, e.g.
OMNITRACE_CAUSAL_PROGRESS
Please note with regard to #2, binary rewrite to insert progress-points is not supported: when a rewritten binary is executed, Dyninst translates the instruction pointer address in order to execute the instrumentation and, as a result, call-stack samples never return instruction pointer addresses in the ranges defined as valid by OmniTrace. Hopefully, a work-around will be found in the future.
Key Concepts
| Concept | Setting | Options | Description |
|---|---|---|---|
| Backend | OMNITRACE_CAUSAL_BACKEND |
perf, timer |
Backend for recording samples required to calculate the virtual speed-up |
| Mode | OMNITRACE_CAUSAL_MODE |
function, line |
Select entire function or individual line of code for causal experiments |
| End-to-End | OMNITRACE_CAUSAL_END_TO_END |
boolean | Perform a single experiment during the entire run (does not require progress-points) |
| Fixed speedup(s) | OMNITRACE_CAUSAL_FIXED_SPEEDUP |
one or more values from [0, 100] | Virtual speedup or pool of virtual speedups to randomly select |
| Binary scope | OMNITRACE_CAUSAL_BINARY_SCOPE |
regular expression(s) | Dynamic binaries containing code for experiments |
| Source scope | OMNITRACE_CAUSAL_SOURCE_SCOPE |
regular expression(s) | <file> and/or <file>:<line> containing code to include in experiments |
| Function scope | OMNITRACE_CAUSAL_FUNCTION_SCOPE |
regular expression(s) | Restricts experiments to matching functions (function mode) or lines of code within matching functions (line mode) |
Notes
Binary scope defaults to
%MAIN%(executable). Scope can be expanded to include linked libraries<file>and<file>:<line>support requires debug info (i.e. code was compiled with-gor, preferably,-g3)Function mode does not require debug info but does not support stripped binaries
Backends
Both causal profiling backends interrupt each thread 1000x per second of CPU-time to apply virtual speedups. The difference between the backends is how the samples which are responsible calculating the virtual speedup are recorded. There are 3 key differences between the two backends:
perfbackend requires Linux Perf and elevated security priviledgesperfbackend interrupts the application less frequently whereas thetimerbackend will interrupt the applicaiton 1000x per second of realtimetimerbackend has less accurate call-stacks due to instruction pointer skid
In general, the "perf" is preferred over the "timer" backend when sufficient security priviledges permit it’s usage.
If "OMNITRACE_CAUSAL_BACKEND" is set to "auto", Omnitrace will fallback to using the "timer" backend only if
using the "perf" backend fails; if "OMNITRACE_CAUSAL_BACKEND" is set to "perf" and using this backend fails, Omnitrace
will abort.
Instruction Pointer Skid
Instruction pointer (IP) skid is how many instructions execute between an event of interest
happening and where the IP is when the kernel is able to stop the application.
For the "timer" backend, this translates to the
difference between when the IP when the timer generated a signal and the IP when the
signal was actually generated. Although IP skid does still occur with the "perf" backend,
the overhead of pausing the entire thread with the "timer" backend makes this much more pronounced
and, as such, the "timer" backend tends to have a lower resolution than the "perf" backend,
especially in "line" mode.
Installing Linux Perf
Linux Perf is built into the kernel and may already be installed (e.g., included in the default kernel for OpenSUSE).
The official method of checking whether Linux Perf is installed is checking for the existence of the file
/proc/sys/kernel/perf_event_paranoid – if the file exists, the kernel has Perf installed.
If this file does not exist, on Debian-based systems like Ubuntu, install (as superuser):
apt-get install linux-tools-common linux-tools-generic linux-tools-$(uname -r)
and reboot your computer. In order to use the "perf" backend, the value of /proc/sys/kernel/perf_event_paranoid
should be <= 2. If the value in this file is greater than 2, you will likely be unable to use the perf backend.
To update the paranoid level temporarily (until the system is rebooted), run one of the following methods
as a superuser (where PARANOID_LEVEL=<N> with <N> in the range `[-1, 2]):
echo ${PARANOID_LEVEL} | sudo tee /proc/sys/kernel/perf_event_paranoid
sysctl kernel.perf_event_paranoid=${PARANOID_LEVEL}
To make the paranoid level persistent after a reboot, add kernel.perf_event_paranoid=<N>
(where <N> is the desired paranoid level) to the /etc/sysctl.conf file.
Speedup Prediction Variability and omnitrace-causal Executable
Causal profiling typically require executing the application several times in order to adequately sample all the domains of executing code, experiment speedups, etc. and resolve statistical fluctuations.
The omnitrace-causal executable is designed to simplify running this procedure:
$ omnitrace-causal --help
[omnitrace-causal] Usage: ./bin/omnitrace-causal [ --help (count: 0, dtype: bool)
                                                   --version (count: 0, dtype: bool)
                                                   --monochrome (max: 1, dtype: bool)
                                                   --debug (max: 1, dtype: bool)
                                                   --verbose (count: 1)
                                                   --config (min: 0, dtype: filepath)
                                                   --launcher (count: 1, dtype: executable)
                                                   --generate-configs (min: 0, dtype: folder)
                                                   --no-defaults (min: 0, dtype: bool)
                                                   --mode (count: 1, dtype: string)
                                                   --output-name (min: 1, dtype: filename)
                                                   --reset (max: 1, dtype: bool)
                                                   --end-to-end (max: 1, dtype: bool)
                                                   --wait (count: 1, dtype: seconds)
                                                   --duration (count: 1, dtype: seconds)
                                                   --iterations (count: 1, dtype: int)
                                                   --speedups (min: 0, dtype: integers)
                                                   --binary-scope (min: 0, dtype: integers)
                                                   --source-scope (min: 0, dtype: integers)
                                                   --function-scope (min: 0, dtype: regex-list)
                                                   --binary-exclude (min: 0, dtype: integers)
                                                   --source-exclude (min: 0, dtype: integers)
                                                   --function-exclude (min: 0, dtype: regex-list)
                                                 ]

    Causal profiling usually requires multiple runs to reliably resolve the speedup estimates.
    This executable is designed to streamline that process.
    For example (assume all commands end with '-- <exe> <args>'):

        omnitrace-causal -n 5 -- <exe>                  # runs <exe> 5x with causal profiling enabled

        omnitrace-causal -s 0 5,10,15,20                # runs <exe> 2x with virtual speedups:
                                                        #   - 0
                                                        #   - randomly selected from 5, 10, 15, and 20

        omnitrace-causal -F func_A func_B func_(A|B)    # runs <exe> 3x with the function scope limited to:
                                                        #   1. func_A
                                                        #   2. func_B
                                                        #   3. func_A or func_B
    General tips:
    - Insert progress points at hotspots in your code or use omnitrace's runtime instrumentation
        - Note: binary rewrite will produce a incompatible new binary
    - Run omnitrace-causal in "function" mode first (does not require debug info)
    - Run omnitrace-causal in "line" mode when you are targeting one function (requires debug info)
        - Preferably, use predictions from the "function" mode to determine which function to target
    - Limit the virtual speedups to a smaller pool, e.g., 0,5,10,25,50, to get reliable predictions quicker
    - Make use of the binary, source, and function scope to limit the functions/lines selected for experiments
        - Note: source scope requires debug info


Options:
    -h, -?, --help                 Shows this page
    --version                      Prints the version and exit

    [DEBUG OPTIONS]

    --monochrome                   Disable colorized output
    --debug                        Debug output
    -v, --verbose                  Verbose output

    [GENERAL OPTIONS]

    -c, --config                   Base configuration file
    -l, --launcher                 When running MPI jobs, omnitrace-causal needs to be *before* the executable which launches the MPI processes (i.e.
                                   before `mpirun`, `srun`, etc.). Pass the name of the target executable (or a regex for matching to the name of the
                                   target) for causal profiling, e.g., `omnitrace-causal -l foo -- mpirun -n 4 foo`. This ensures that the omnitrace
                                   library is LD_PRELOADed on the proper target
    -g, --generate-configs         Generate config files instead of passing environment variables directly. If no arguments are provided, the config files
                                   will be placed in ${PWD}/omnitrace-causal-config folder
    --no-defaults                  Do not activate default features which are recommended for causal profiling. For example: PID-tagging of output files
                                   and timestamped subdirectories are disabled by default. Kokkos tools support is added by default
                                   (OMNITRACE_USE_KOKKOSP=ON) because, for Kokkos applications, the Kokkos-Tools callbacks are used for progress points.
                                   Activation of OpenMP tools support is similar

    [CAUSAL PROFILING OPTIONS (General)]
                                   (These settings will be applied to all causal profiling runs)

    -m, --mode [ function (func) | line ]
                                   Causal profiling mode
    -o, --output-name              Output filename of causal profiling data w/o extension
    -r, --reset                    Overwrite any existing experiment results during the first run
    -e, --end-to-end               Single causal experiment for the entire application runtime
    -w, --wait                     Set the wait time (i.e. delay) before starting the first causal experiment (in seconds)
    -d, --duration                 Set the length of time (in seconds) to perform causal experimentationafter the first experiment is started. Once this
                                   amount of time has elapsed, no more causal experiments will be started but any currently running experiment will be
                                   allowed to finish.
    -n, --iterations               Number of times to repeat the combination of run configurations

    [CAUSAL PROFILING OPTIONS (Combinatorial)]
                                   (Each individual argument to these options will multiply the number runs by the number of arguments and the number of
                                   iterations. E.g. -n 2 -B "MAIN" -F "foo" "bar" will produce 4 runs: 2 iterations x 1 binary scope x 2 function scopes
                                   (MAIN+foo, MAIN+bar, MAIN+foo, MAIN+bar))

    -s, --speedups                 Pool of virtual speedups to sample from during experimentation. Each space designates a group and multiple speedups can
                                   be grouped together by commas, e.g. -s 0 0,10,20-50 is two groups: group #1 is '0' and group #2 is '0 10 20 25 30 35 40
                                   45 50'
    -B, --binary-scope             Restricts causal experiments to the binaries matching the list of regular expressions. Each space designates a group
                                   and multiple scopes can be grouped together with a semi-colon
    -S, --source-scope             Restricts causal experiments to the source files or source file + lineno pairs (i.e. <file> or <file>:<line>) matching
                                   the list of regular expressions. Each space designates a group and multiple scopes can be grouped together with a
                                   semi-colon
    -F, --function-scope           Restricts causal experiments to the functions matching the list of regular expressions. Each space designates a group
                                   and multiple scopes can be grouped together with a semi-colon
    -BE, --binary-exclude          Excludes causal experiments from being performed on the binaries matching the list of regular expressions. Each space
                                   designates a group and multiple excludes can be grouped together with a semi-colon
    -SE, --source-exclude          Excludes causal experiments from being performed on the code from the source files or source file + lineno pair (i.e.
                                   <file> or <file>:<line>) matching the list of regular expressions. Each space designates a group and multiple excludes
                                   can be grouped together with a semi-colon
    -FE, --function-exclude        Excludes causal experiments from being performed on the functions matching the list of regular expressions. Each space
                                   designates a group and multiple excludes can be grouped together with a semi-colon
Examples
#!/bin/bash -e

module load omnitrace

N=20
I=3

# when providing speedups to omnitrace-causal, speedup
# groups are separated by a space so "0,10" results in
# one speedup group where omnitrace samples from
# the speedup set of {0, 10}. Passing "0 10" (without
# quotes to omnitrace-causal multiplies the
# number of runs by 2, where the first half of the
# runs instruct omnitrace to only use 0 as the
# speedup and the second half of the runs instruct
# omnitrace to only use 10 as the speedup.
SPEEDUPS="0,0,0,10,20,30,40,50,50,75,75,75,90,90,90"
# thus, -s ${SPEEDUPS} only multiplies the number
# of runs by 1 whereas -S ${SPEEDUPS_E2E} multiplies
# the number of runs by 15:
#   - 3 runs with speedup of 0
#   - 1 run for each of the speedups 10, 20, 30, and 40
#   - 2 runs with speedup of 50
#   - 3 runs with speedup of 75
#   - 3 runs with speedup of 90
SPEEDUPS_E2E=$(echo "${SPEEDUPS}" | sed 's/,/ /g')


# 20 iterations in function mode with 1 speedup group
# and source scope set to .cpp files
#
# outputs to files:
#   - causal/experiments.func.coz
#   - causal/experiments.func.json
#
# total executions: 20
#
omnitrace-causal        \
    -n ${N}             \
    -s ${SPEEDUPS}      \
    -m function         \
    -o experiments.func \
    -S ".*\\.cpp"       \
    --                  \
    ./causal-omni-cpu "${@}"


# 20 iterations in line mode with 1 speedup group
# and source scope restricted to lines 100 and 110
# in the causal.cpp file.
#
# outputs to files:
#   - causal/experiments.line.coz
#   - causal/experiments.line.json
#
# total executions: 20
#
omnitrace-causal                \
    -n ${N}                     \
    -s ${SPEEDUPS}              \
    -m line                     \
    -o experiments.line         \
    -S "causal\\.cpp:(100|110)" \
    --                          \
    ./causal-omni-cpu "${@}"


# 3 iterations in function mode of 15 singular speedups
# in end-to-end mode with 2 different function scopes
# where one is restricted to "cpu_slow_func" and
# another is restricted to "cpu_fast_func".
#
# outputs to files:
#   - causal/experiments.func.e2e.coz
#   - causal/experiments.func.e2e.json
#
# total executions: 90
#
omnitrace-causal            \
    -n ${I}                 \
    -s ${SPEEDUPS_E2E}      \
    -m func                 \
    -e                      \
    -o experiments.func.e2e \
    -F "cpu_slow_func"      \
       "cpu_fast_func"      \
    --                      \
    ./causal-omni-cpu "${@}"

# 3 iterations in line mode of 15 singular speedups
# in end-to-end mode with 2 different source scopes
# where one is restricted to line 100 in causal.cpp
# and another is restricted to line 110 in causal.cpp.
#
# outputs to files:
#   - causal/experiments.line.e2e.coz
#   - causal/experiments.line.e2e.json
#
# total executions: 90
#
omnitrace-causal            \
    -n ${I}                 \
    -s ${SPEEDUPS_E2E}      \
    -m line                 \
    -e                      \
    -o experiments.line.e2e \
    -S "causal\\.cpp:100"   \
       "causal\\.cpp:110"   \
    --                      \
    ./causal-omni-cpu "${@}"


export OMP_NUM_THREADS=8
export OMP_PROC_BIND=spread
export OMP_PLACES=threads

# set number of iterations to 5
N=5

# 5 iterations in function mode of 1 speedup
# group with the source scope restricted
# to files containing "lulesh" in their filename
# and exclude functions which start with "Kokkos::"
# or "std::enable_if".
#
# outputs to files:
#   - causal/experiments.func.coz
#   - causal/experiments.func.json
#
# total executions: 5
#
# First of 5 executions overwrites any
# existing causal/experiments.func.(coz|json)
# file due to "--reset" argument
#
omnitrace-causal                            \
    --reset                                 \
    -n ${N}                                 \
    -s ${SPEEDUPS}                          \
    -m func                                 \
    -o experiments.func                     \
    -S "lulesh.*"                           \
    -FE "^(Kokkos::|std::enable_if)"        \
    --                                      \
    ./lulesh-omni -i 50 -s 200 -r 20 -b 5 -c 5 -p


# 5 iterations in line mode of 1 speedup
# group with the source scope restricted
# to files containing "lulesh" in their filename
# and exclude functions which start with "exec_range"
# or "execute" and which contain either
# "construct_shared_allocation" or "._omp_fn." in
# the function name.
#
# outputs to files:
#   - causal/experiments.line.coz
#   - causal/experiments.line.json
#
# total executions: 5
#
# First of 5 executions overwrites any
# existing causal/experiments.line.(coz|json)
# file due to "--reset" argument
#
omnitrace-causal                            \
    --reset                                 \
    -n ${N}                                 \
    -s ${SPEEDUPS}                          \
    -m line                                 \
    -o experiments.line                     \
    -S "lulesh.*"                           \
    -FE "^(exec_range|execute);construct_shared_allocation;\\._omp_fn\\." \
    --                                      \
    ./lulesh-omni -i 50 -s 200 -r 20 -b 5 -c 5 -p


# 5 iterations in line mode of 1 speedup
# group with the source scope restricted
# to files whose basename is "lulesh.cc"
# for 3 different functions:
#   - ApplyMaterialPropertiesForElems
#   - CalcHourglassControlForElems
#   - CalcVolumeForceForElems
#
# outputs to files:
#   - causal/experiments.line.targeted.coz
#   - causal/experiments.line.targeted.json
#
# total executions: 15
#
# First of 5 executions overwrites any
# existing causal/experiments.line.(coz|json)
# file due to "--reset" argument
#
omnitrace-causal                            \
    --reset                                 \
    -n ${N}                                 \
    -s ${SPEEDUPS}                          \
    -m line                                 \
    -o experiments.line.targeted            \
    -F "ApplyMaterialPropertiesForElems"    \
       "CalcHourglassControlForElems"       \
       "CalcVolumeForceForElems"            \
    -S "lulesh\\.cc"                        \
    --                                      \
    ./lulesh-omni -i 50 -s 200 -r 20 -b 5 -c 5 -p
Using omnitrace-causal with other launchers (e.g. mpirun)
The omnitrace-causal executable is intended to assist with application replay and is designed to always be at the start of the command-line (i.e. the primary process).
omnitrace-causal typically adds a LD_PRELOAD of the OmniTrace libraries into the environment before launching the command in order to inject the functionality
required to start the causal profiling tooling. However, this is problematic when the target application for causal profiling requires another command-line
tool in order to run, e.g. foo is the target application but executing foo requires mpirun -n 2 foo. If one were to simply do omnitrace-causal -- mpirun -n 2 foo,
then the causal profiling would be applied to mpirun instead of foo. omnitrace-causal remedies this by providing a command-line option -l / --launcher
to indicate the target application is using a launcher script/executable. The argument to the command-line option is the name of (or regex for) the target application
on the command-line. When --launcher is used, omnitrace-causal will generate all the replay configurations and execute them but delay adding the LD_PRELOAD, instead it
will inject a call to itself into the command-line right before the target application. This recursive call to itself will inherit the configuration from
parent omnitrace-causal executable, insert an LD_PRELOAD into the environment, and then invoke an execv to replace itself with the new process launched by the target
application.
In other words, the following command:
omnitrace-causal -l foo -n 3 -- mpirun -n 2 foo`
Effectively results in:
mpirun -n 2 omnitrace-causal -- foo
mpirun -n 2 omnitrace-causal -- foo
mpirun -n 2 omnitrace-causal -- foo
Visualizing the Causal Output
OmniTrace generates a causal/experiments.json and causal/experiments.coz in ${OMNITRACE_OUTPUT_PATH}/${OMNITRACE_OUTPUT_PREFIX}. A standalone GUI for viewing the causal profiling
results in under development but until this is available, visit plasma-umass.org/coz/ and open the *.coz file.
OmniTrace vs. Coz
This section is intended for readers who are familiar with the Coz profiler. OmniTrace provides several additional features and utilities for causal profiling:
| Coz | OmniTrace | Notes | |
|---|---|---|---|
| Debug info | requires debug info in DWARF v3 format (-gdwarf-3) |
optional, supports any DWARF format version | See Note #1 below |
| Experiment selection | <file>:<line> |
<function> or <file>:<line> |
See Note #2 below |
| Experiment speedups | Randomly samples b/t 0..100 in increments of 5 or one fixed speedup | Supports specifying smaller subset | Set Note #3 below |
| Scope options | Supports binary and source scopes | Supports binary, source, and function scopes | See Note #4, #5, and #6 below |
| Scope inclusion | Uses % as wildcard for binary and source scopes |
Full regex support for binary, source, and function scopes | |
| Scope exclusion | Not supported | Supports regexes for excluding binary/source/function | See Note #7 below |
| Call-stack sampling | Linux perf | Linux perf, libunwind | See Note #8 below |
OmniTrace supports a “function” mode which does not require debug info
OmniTrace supports selecting entire range of instruction pointers for a function instead of instruction pointer for one line. In large codes, “function” mode can resolve in fewer iterations and once a target function is identified, one can switch to line mode and limit the function scope to the target function
OmniTrace supports randomly sampling from subsets, e.g. { 0, 0, 5, 10 } where 0% is randomly selected 50% of time and 5% and 10% are randomly selected 25% of the time
OmniTrace and COZ have same definition for binary scope: the binaries loaded at runtime (e.g. executable and linked libraries)
OmniTrace “source scope” supports both
<file>and<file>:<line>formats in contrast to COZ “source scope” which requires<file>:<line>formatOmniTrace supports a “function” scope which narrows the functions/lines which are eligible for causal experiments to those within the matching functions
OmniTrace supports a second filter on scopes for removing binary/source/function caught by inclusive match, e.g.
BINARY_SCOPE=.*+BINARY_EXCLUDE=libmpi.*initially includes all binaries but exclude regex removes MPI librariesIn Omnitrace, the Linux perf backend is preferred over use libunwind. However, Linux perf usage can be restricted for security reasons. Omnitrace will fallback to using a second POSIX timer and libunwind if Linux perf is not available.