High Level Design
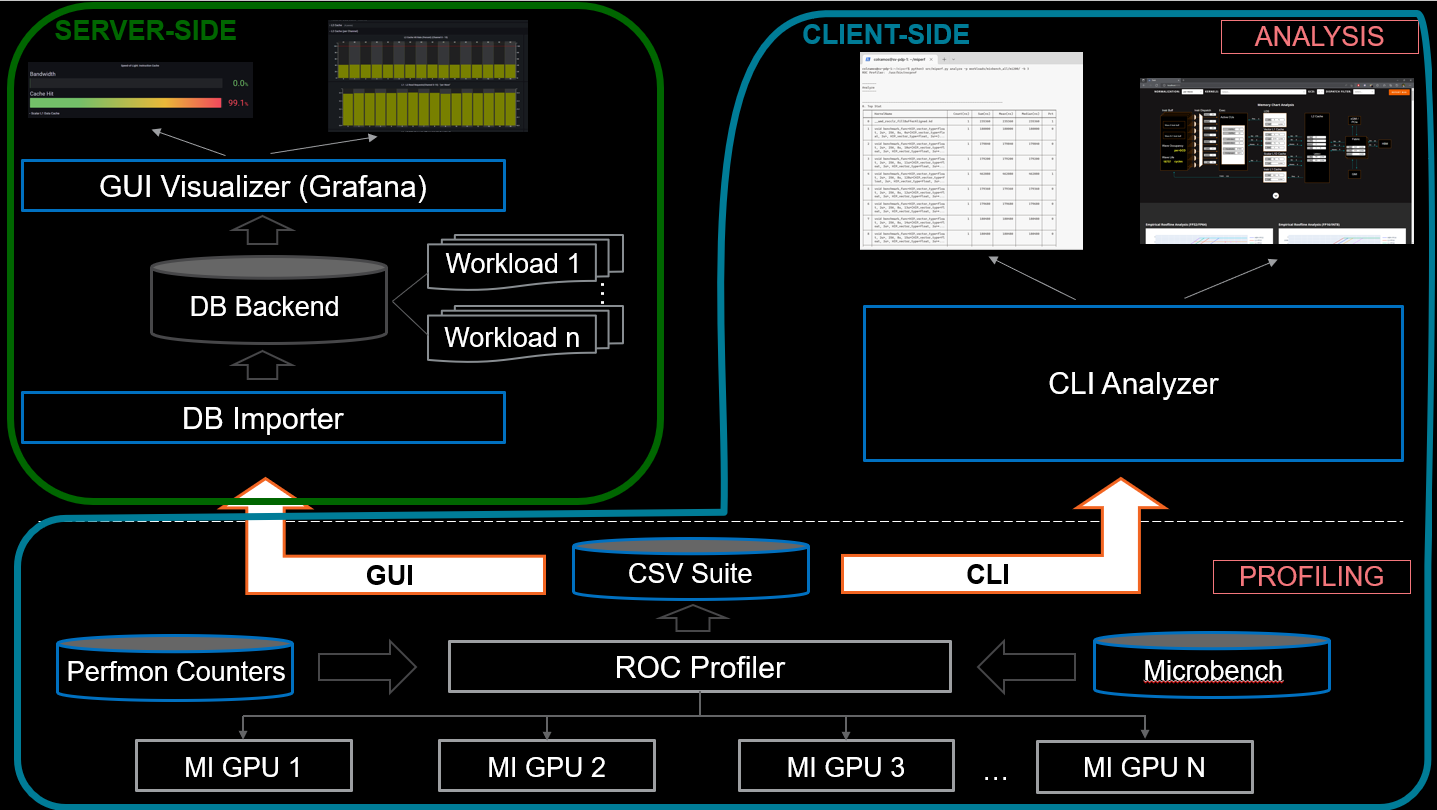
The Omniperf Tool is architecturally composed of three major components, as shown in the following figure.
Omniperf Profiling: Acquire raw performance counters via application replay based on rocProf. The counters are stored in a comma-separated format, for further analysis. A set of MI200 specific micro benchmarks are also run to acquire the hierarchical roofline data. The roofline model is not available on earlier accelerators.
Omniperf Grafana Analyzer:
Grafana database import: All raw performance counters are imported into the backend MongoDB database for Grafana GUI analysis and visualization. Compatibility of previously generated data between Omniperf versions is not necessarily guaranteed.
Grafana GUI Analyzer: A Grafana dashboard is designed to retrieve the raw counters info from the backend database. It also creates the relevant performance metrics and visualization.
Omniperf Standalone GUI Analyzer: A standalone GUI is provided to enable performance analysis without importing data into the backend database.
Note
To learn more about the client vs. server model of Omniperf and our install process please see the Deployment section of the docs.