Profile Mode
The Omniperf repository
includes source code for a sample GPU compute workload,
vcopy.cpp. A copy of this file is available in the share/sample
subdirectory after a normal Omniperf installation, or via the
$OMNIPERF_SHARE/sample directory when using the supplied modulefile.
A compiled version of this workload is used throughout the following sections to demonstrate the use of Omniperf in MI GPU performance analysis. Unless otherwise noted, the performance analysis is done on the MI200 platform.
Workload Compilation
vcopy compilation:
$ hipcc vcopy.cpp -o vcopy
$ ls
vcopy   vcopy.cpp
$ ./vcopy -n 1048576 -b 256
vcopy testing on GCD 0
Finished allocating vectors on the CPU
Finished allocating vectors on the GPU
Finished copying vectors to the GPU
sw thinks it moved 1.000000 KB per wave
Total threads: 1048576, Grid Size: 4096 block Size:256, Wavefronts:16384:
Launching the  kernel on the GPU
Finished executing kernel
Finished copying the output vector from the GPU to the CPU
Releasing GPU memory
Releasing CPU memory
Omniperf Profiling
The omniperf executable, available through the Omniperf repository, is used to acquire all necessary performance monitoring data through analysis of compute workloads.
Features
Automate counter collection: Omniperf handles all of your profiling via preconfigured input files.
Filtering: Apply runtime filters to speed up the profiling process.
Standalone Roofline: Isolate a subset of built-in metrics or build your own profiling configuration.
Run omniperf profile -h for more details.
Demo
The following sample command profiles the vcopy workload.
vcopy profiling:
$ omniperf profile --name vcopy -- ./vcopy -n 1048576 -b 256

  ___                  _                  __
 / _ \ _ __ ___  _ __ (_)_ __   ___ _ __ / _|
| | | | '_ ` _ \| '_ \| | '_ \ / _ \ '__| |_
| |_| | | | | | | | | | | |_) |  __/ |  |  _|
 \___/|_| |_| |_|_| |_|_| .__/ \___|_|  |_|
                        |_|

Omniperf version: 2.0.0
Profiler choice: rocprofv1
Path: /home/auser/repos/omniperf/sample/workloads/vcopy/MI200
Target: MI200
Command: ./vcopy -n 1048576 -b 256
Kernel Selection: None
Dispatch Selection: None
Hardware Blocks: All

~~~~~~~~~~~~~~~~~~~~~~~~~~~~~~~~
Collecting Performance Counters
~~~~~~~~~~~~~~~~~~~~~~~~~~~~~~~~

[profiling] Current input file: /home/auser/repos/omniperf/sample/workloads/vcopy/MI200/perfmon/SQ_IFETCH_LEVEL.txt
   |-> [rocprof] RPL: on '240312_174329' from '/opt/rocm-5.2.1' in '/home/auser/repos/omniperf/src/omniperf'
   |-> [rocprof] RPL: profiling '""./vcopy -n 1048576 -b 256""'
   |-> [rocprof] RPL: input file '/home/auser/repos/omniperf/sample/workloads/vcopy/MI200/perfmon/SQ_IFETCH_LEVEL.txt'
   |-> [rocprof] RPL: output dir '/tmp/rpl_data_240312_174329_692890'
   |-> [rocprof] RPL: result dir '/tmp/rpl_data_240312_174329_692890/input0_results_240312_174329'
   |-> [rocprof] ROCProfiler: input from "/tmp/rpl_data_240312_174329_692890/input0.xml"
   |-> [rocprof] gpu_index =
   |-> [rocprof] kernel =
   |-> [rocprof] range =
   |-> [rocprof] 6 metrics
   |-> [rocprof] GRBM_COUNT, GRBM_GUI_ACTIVE, SQ_WAVES, SQ_IFETCH, SQ_IFETCH_LEVEL, SQ_ACCUM_PREV_HIRES
   |-> [rocprof] vcopy testing on GCD 0
   |-> [rocprof] Finished allocating vectors on the CPU
   |-> [rocprof] Finished allocating vectors on the GPU
   |-> [rocprof] Finished copying vectors to the GPU
   |-> [rocprof] sw thinks it moved 1.000000 KB per wave
   |-> [rocprof] Total threads: 1048576, Grid Size: 4096 block Size:256, Wavefronts:16384:
   |-> [rocprof] Launching the  kernel on the GPU
   |-> [rocprof] Finished executing kernel
   |-> [rocprof] Finished copying the output vector from the GPU to the CPU
   |-> [rocprof] Releasing GPU memory
   |-> [rocprof] Releasing CPU memory
   |-> [rocprof]
   |-> [rocprof] ROCPRofiler: 1 contexts collected, output directory /tmp/rpl_data_240312_174329_692890/input0_results_240312_174329
   |-> [rocprof] File '/home/auser/repos/omniperf/sample/workloads/vcopy/MI200/SQ_IFETCH_LEVEL.csv' is generating
   |-> [rocprof]
[profiling] Current input file: /home/auser/repos/omniperf/sample/workloads/vcopy/MI200/perfmon/SQ_INST_LEVEL_LDS.txt

...

[roofline] Checking for roofline.csv in /home/auser/repos/omniperf/sample/workloads/vcopy/MI200
[roofline] No roofline data found. Generating...
Empirical Roofline Calculation
Copyright © 2022  Advanced Micro Devices, Inc. All rights reserved.
Total detected GPU devices: 4
GPU Device 0: Profiling...
 99% [||||||||||||||||||||||||||||||||||||||||||||||||||||||||||| ]
HBM BW, GPU ID: 0, workgroupSize:256, workgroups:2097152, experiments:100, traffic:8589934592 bytes, duration:6.2 ms, mean:1388.0 GB/sec, stdev=3.1 GB/sec
 99% [||||||||||||||||||||||||||||||||||||||||||||||||||||||||||| ]
L2 BW, GPU ID: 0, workgroupSize:256, workgroups:8192, experiments:100, traffic:687194767360 bytes, duration:136.5 ms, mean:5020.8 GB/sec, stdev=16.5 GB/sec
 99% [||||||||||||||||||||||||||||||||||||||||||||||||||||||||||| ]
L1 BW, GPU ID: 0, workgroupSize:256, workgroups:16384, experiments:100, traffic:26843545600 bytes, duration:2.9 ms, mean:9229.5 GB/sec, stdev=2.9 GB/sec
 99% [||||||||||||||||||||||||||||||||||||||||||||||||||||||||||| ]
LDS BW, GPU ID: 0, workgroupSize:256, workgroups:16384, experiments:100, traffic:33554432000 bytes, duration:1.9 ms, mean:17645.6 GB/sec, stdev=20.1 GB/sec
 99% [||||||||||||||||||||||||||||||||||||||||||||||||||||||||||| ]
Peak FLOPs (FP32), GPU ID: 0, workgroupSize:256, workgroups:16384, experiments:100, FLOP:274877906944, duration:13.078 ms, mean:20986.9 GFLOPS, stdev=310.8 GFLOPS
 99% [||||||||||||||||||||||||||||||||||||||||||||||||||||||||||| ]
Peak FLOPs (FP64), GPU ID: 0, workgroupSize:256, workgroups:16384, experiments:100, FLOP:137438953472, duration:6.7 ms, mean:20408.029297.1 GFLOPS, stdev=2.7 GFLOPS
 99% [||||||||||||||||||||||||||||||||||||||||||||||||||||||||||| ]
Peak MFMA FLOPs (BF16), GPU ID: 0, workgroupSize:256, workgroups:16384, experiments:100, FLOP:2147483648000, duration:12.6 ms, mean:170280.0 GFLOPS, stdev=22.3 GFLOPS
 99% [||||||||||||||||||||||||||||||||||||||||||||||||||||||||||| ]
Peak MFMA FLOPs (F16), GPU ID: 0, workgroupSize:256, workgroups:16384, experiments:100, FLOP:2147483648000, duration:13.0 ms, mean:164733.6 GFLOPS, stdev=24.3 GFLOPS
 99% [||||||||||||||||||||||||||||||||||||||||||||||||||||||||||| ]
Peak MFMA FLOPs (F32), GPU ID: 0, workgroupSize:256, workgroups:16384, experiments:100, FLOP:536870912000, duration:13.0 ms, mean:41399.6 GFLOPS, stdev=4.1 GFLOPS
 99% [||||||||||||||||||||||||||||||||||||||||||||||||||||||||||| ]
Peak MFMA FLOPs (F64), GPU ID: 0, workgroupSize:256, workgroups:16384, experiments:100, FLOP:268435456000, duration:6.5 ms, mean:41379.2 GFLOPS, stdev=4.4 GFLOPS
 99% [||||||||||||||||||||||||||||||||||||||||||||||||||||||||||| ]
Peak MFMA IOPs (I8), GPU ID: 0, workgroupSize:256, workgroups:16384, experiments:100, IOP:2147483648000, duration:12.9 ms, mean:166281.9 GOPS, stdev=2495.9 GOPS
GPU Device 1: Profiling...
...
GPU Device 2: Profiling...
...
GPU Device 3: Profiling...
...
You will notice two main stages in default Omniperf profiling.
The first stage collects all the counters needed for Omniperf analysis (omitting any filters you have provided).
The second stage collects data for the roofline analysis (this stage can be disabled using
--no-roof)
In this document, we use the term System on Chip (SoC) to refer to a particular family of accelerators. At the end of profiling, all resulting csv files should be located in a SoC specific target directory, e.g.:
“MI300A” or “MI300X” for the AMD Instinct ™ MI300 family of accelerators
“MI200” for the AMD Instinct ™ MI200 family of accelerators
“MI100” for the AMD Instinct ™ MI100 family of accelerators
etc.
The SoC names are generated as a part of Omniperf, and do not always distinguish between different accelerators in the same family (e.g., an AMD Instinct ™ MI210 vs an MI250)
Note
Additionally, you will notice a few extra files. An SoC parameters file, sysinfo.csv, is created to reflect the target device settings. All profiling output is stored in log.txt. Roofline specific benchmark results are stored in roofline.csv.
$ ls workloads/vcopy/MI200/
total 112
total 60
-rw-r--r-- 1 auser agroup 27937 Mar  1 15:15 log.txt
drwxr-xr-x 1 auser agroup     0 Mar  1 15:15 perfmon
-rw-r--r-- 1 auser agroup 26175 Mar  1 15:15 pmc_perf.csv
-rw-r--r-- 1 auser agroup  1708 Mar  1 15:17 roofline.csv
-rw-r--r-- 1 auser agroup   519 Mar  1 15:15 SQ_IFETCH_LEVEL.csv
-rw-r--r-- 1 auser agroup   456 Mar  1 15:15 SQ_INST_LEVEL_LDS.csv
-rw-r--r-- 1 auser agroup   474 Mar  1 15:15 SQ_INST_LEVEL_SMEM.csv
-rw-r--r-- 1 auser agroup   474 Mar  1 15:15 SQ_INST_LEVEL_VMEM.csv
-rw-r--r-- 1 auser agroup   599 Mar  1 15:15 SQ_LEVEL_WAVES.csv
-rw-r--r-- 1 auser agroup   650 Mar  1 15:15 sysinfo.csv
-rw-r--r-- 1 auser agroup   399 Mar  1 15:15 timestamps.csv
Filtering
To reduce profiling time and the counters collected one may use profiling filters. Profiling filters and their functionality depend on the underlying profiler being used. While Omniperf is profiler agnostic, we have provided a detailed description of profiling filters available when using Omniperf with rocProf below.
Filtering Options:
The
-k/--kernel<kernel-substr> flag allows for kernel filtering. Usage is equivalent with the current rocProf utility (see details below).The
-d/--dispatch<dispatch-id> flag allows for dispatch ID filtering. Usage is equivalent with the current rocProf utility (see details below).The
-b/--block<block-name> flag allows system profiling on one or more selected hardware components to speed up the profiling process (see details below).
Tip
Be cautious while combining different profiling filters in the same call. Conflicting filters may result in error.
i.e. filtering dispatch X, but dispatch X does not match your kernel name filter
Hardware Component Filtering
One can profile specific hardware components to speed up the profiling process. In Omniperf, we use the term hardware block to refer to a hardware component or a group of hardware components. All profiling results are accumulated in the same target directory, without overwriting those for other hardware components, hence enabling the incremental profiling and analysis.
The following example only gathers hardware counters for the Shader Sequencer (SQ) and L2 Cache (TCC) components, skipping all other hardware components:
$ omniperf profile --name vcopy -b SQ TCC -- ./vcopy -n 1048576 -b 256

  ___                  _                  __
 / _ \ _ __ ___  _ __ (_)_ __   ___ _ __ / _|
| | | | '_ ` _ \| '_ \| | '_ \ / _ \ '__| |_
| |_| | | | | | | | | | | |_) |  __/ |  |  _|
 \___/|_| |_| |_|_| |_|_| .__/ \___|_|  |_|
                        |_|

fname: pmc_cpc_perf: Skipped
fname: pmc_spi_perf: Skipped
fname: pmc_cpf_perf: Skipped
fname: pmc_tcp_perf: Skipped
fname: pmc_sq_perf4: Added
fname: pmc_tcc_perf: Added
fname: pmc_sq_perf8: Added
fname: pmc_ta_perf: Skipped
fname: pmc_sq_perf1: Added
fname: pmc_sq_perf3: Added
fname: pmc_td_perf: Skipped
fname: pmc_tcc2_perf: Skipped
fname: pmc_sqc_perf1: Skipped
fname: pmc_sq_perf6: Added
fname: pmc_sq_perf2: Added
Omniperf version: 2.0.0
Profiler choice: rocprofv1
Path: /home/auser/repos/omniperf/sample/workloads/vcopy/MI200
Target: MI200
Command: ./vcopy -n 1048576 -b 256
Kernel Selection: None
Dispatch Selection: None
Hardware Blocks: ['sq', 'tcc']

~~~~~~~~~~~~~~~~~~~~~~~~~~~~~~~~
Collecting Performance Counters
~~~~~~~~~~~~~~~~~~~~~~~~~~~~~~~~
...
Kernel Filtering
Kernel filtering is based on the name of the kernel(s) you would like to isolate. Use a kernel name substring list to isolate desired kernels.
The following example demonstrates profiling isolating the kernel matching substring “vecCopy”:
$ omniperf profile --name vcopy -k vecCopy -- ./vcopy -n 1048576 -b 256

  ___                  _                  __
 / _ \ _ __ ___  _ __ (_)_ __   ___ _ __ / _|
| | | | '_ ` _ \| '_ \| | '_ \ / _ \ '__| |_
| |_| | | | | | | | | | | |_) |  __/ |  |  _|
 \___/|_| |_| |_|_| |_|_| .__/ \___|_|  |_|
                        |_|

Omniperf version: 2.0.0
Profiler choice: rocprofv1
Path: /home/auser/repos/omniperf/sample/workloads/vcopy/MI200
Target: MI200
Command: ./vcopy -n 1048576 -b 256
Kernel Selection: ['vecCopy']
Dispatch Selection: None
Hardware Blocks: All

~~~~~~~~~~~~~~~~~~~~~~~~~~~~~~~~
Collecting Performance Counters
~~~~~~~~~~~~~~~~~~~~~~~~~~~~~~~~
...
Dispatch Filtering
Dispatch filtering is based on the global dispatch index of kernels in a run.
The following example profiles only the first kernel dispatch in execution of the application (please note zero-based indexing):
$ omniperf profile --name vcopy -d 0 -- ./vcopy -n 1048576 -b 256

  ___                  _                  __
 / _ \ _ __ ___  _ __ (_)_ __   ___ _ __ / _|
| | | | '_ ` _ \| '_ \| | '_ \ / _ \ '__| |_
| |_| | | | | | | | | | | |_) |  __/ |  |  _|
 \___/|_| |_| |_|_| |_|_| .__/ \___|_|  |_|
                        |_|

Omniperf version: 2.0.0
Profiler choice: rocprofv1
Path: /home/auser/repos/omniperf/sample/workloads/vcopy/MI200
Target: MI200
Command: ./vcopy -n 1048576 -b 256
Kernel Selection: None
Dispatch Selection: ['0']
Hardware Blocks: All

~~~~~~~~~~~~~~~~~~~~~~~~~~~~~~~~
Collecting Performance Counters
~~~~~~~~~~~~~~~~~~~~~~~~~~~~~~~~
...
Standalone Roofline
If you are only interested in generating roofline analysis data try using --roof-only. This will only collect counters relevant to roofline, as well as generate a standalone .pdf output of your roofline plot.
Standalone Roofline Options:
The
--sort<desired_sort> allows you to specify whether you would like to overlay top kernel or top dispatch data in your roofline plot.The
-m/--mem-level<cache_level> allows you to specify specific level(s) of cache you would like to include in your roofline plot.The
--device<gpu_id> allows you to specify a device id to collect performance data from when running our roofline benchmark on your system.If you would like to distinguish different kernels in your .pdf roofline plot use
--kernel-names. This will give each kernel a unique marker identifiable from the plot’s key.
Roofline Only
The following example demonstrates profiling roofline data only:
$ omniperf profile --name vcopy --roof-only -- ./vcopy -n 1048576 -b 256

...
[roofline] Checking for roofline.csv in /home/auser/repos/omniperf/sample/workloads/vcopy/MI200
[roofline] No roofline data found. Generating...
Checking for roofline.csv in /home/auser/repos/omniperf/sample/workloads/vcopy/MI200
Empirical Roofline Calculation
Copyright © 2022  Advanced Micro Devices, Inc. All rights reserved.
Total detected GPU devices: 4
GPU Device 0: Profiling...
 99% [||||||||||||||||||||||||||||||||||||||||||||||||||||||||||| ]
 ...
Empirical Roofline PDFs saved!
An inspection of our workload output folder shows .pdf plots were generated successfully
$ ls workloads/vcopy/MI200/
total 48
-rw-r--r-- 1 auser agroup 13331 Mar  1 16:05 empirRoof_gpu-0_fp32_fp64.pdf
-rw-r--r-- 1 auser agroup 13136 Mar  1 16:05 empirRoof_gpu-0_int8_fp16.pdf
drwxr-xr-x 1 auser agroup     0 Mar  1 16:03 perfmon
-rw-r--r-- 1 auser agroup  1101 Mar  1 16:03 pmc_perf.csv
-rw-r--r-- 1 auser agroup  1715 Mar  1 16:05 roofline.csv
-rw-r--r-- 1 auser agroup   650 Mar  1 16:03 sysinfo.csv
-rw-r--r-- 1 auser agroup   399 Mar  1 16:03 timestamps.csv
Note
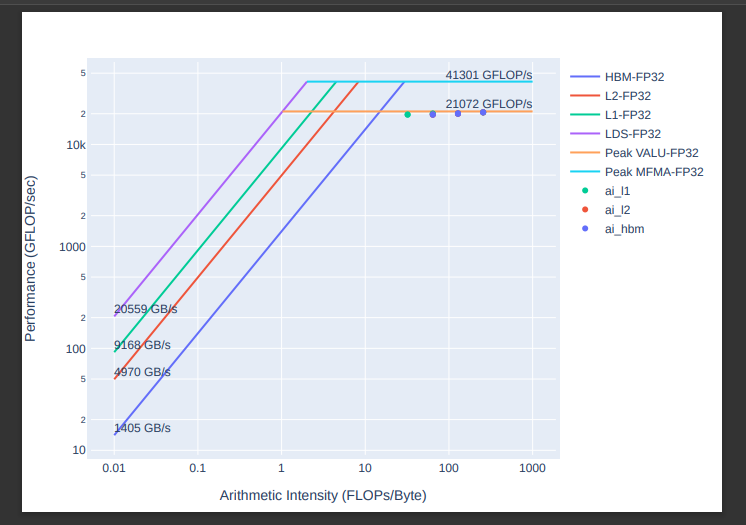
Omniperf generates two roofline outputs to organize results and reduce clutter. One chart plots FP32/FP64 performance while the other plots I8/FP16 performance.
A sample empirRoof_gpu-ALL_fp32_fp64.pdf looks something like this: