AMD Instinct™ MI Series Accelerator Performance Model
Omniperf makes available an extensive list of metrics to better understand achieved application performance on AMD Instinct™ MI accelerators including Graphics Core Next (GCN) GPUs such as the AMD Instinct MI50, CDNA™ accelerators such as the MI100, and CDNA™ 2 accelerators such as MI250X/250/210.
To best utilize this profiling data, it is vital to understand the role of various hardware blocks of AMD Instinct accelerators. This section aims to describe each hardware block on the accelerator as interacted with by a software developer, and give a deeper understanding of the metrics reported therein. Refer to Profiling with Omniperf by Example for more practical examples and detail on how to use Omniperf to optimize your code.
Note
In this document, we use MI2XX to refer to any of the AMD Instinct™ MI250X, MI250, and MI210 CDNA2 accelerators interchangeably for situations where the exact product in question is not relevant.
For more details on the differences between these accelerators, we refer the reader to the MI250X, MI250 and MI210 product pages.
Compute Unit (CU)
The Compute Unit (CU) is responsible for executing a user’s kernels on AMD’s CDNA™ accelerators. All wavefronts of a workgroup are scheduled on the same CU.
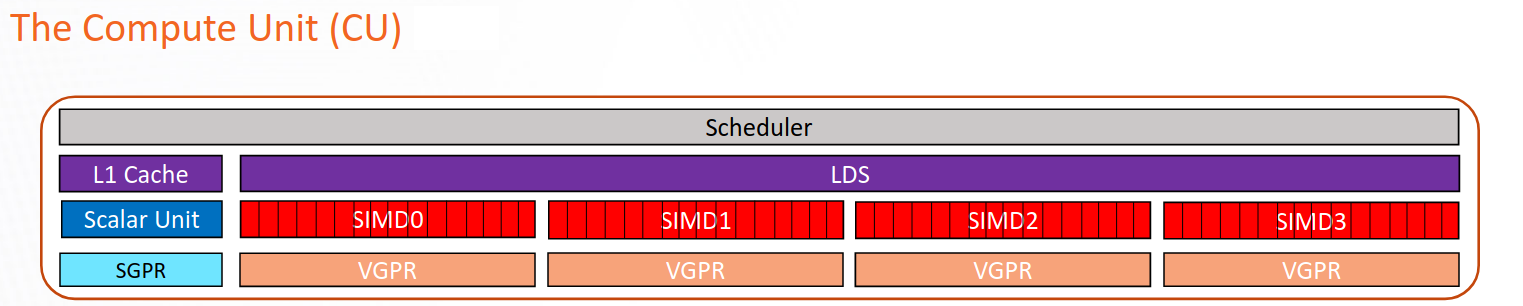
The CU consists of several independent pipelines / functional units:
The vector arithmetic logic unit (VALU) is composed of multiple Single Instruction Multiple Data (SIMD) vector processors, Vector General Purpose Registers (VGPRs) and instruction buffers. The VALU is responsible for executing much of the computational work on CDNA accelerators, including (but not limited to) floating-point operations (FLOPs), integer operations (IOPs), etc.
The vector memory (VMEM) unit is responsible for issuing loads, stores and atomic operations that interact with the memory system.
The Scalar Arithmetic Logic Unit (SALU) is shared by all threads in a wavefront, and is responsible for executing instructions that are known to be uniform across the wavefront at compile-time. The SALU has a memory unit (SMEM) for interacting with memory, but it cannot issue separately from the SALU.
The Local Data Share (LDS) is an on-CU software-managed scratchpad memory that can be used to efficiently share data between all threads in a workgroup.
The scheduler is responsible for issuing and decoding instructions for all the wavefronts on the compute unit.
The vector L1 data cache (vL1D) is the first level cache local to the compute unit. On current CDNA accelerators, the vL1D is write-through. The vL1D caches from multiple compute units are kept coherent with one another through software instructions.
CDNA accelerators — i.e., the MI100 and newer — contain specialized matrix-multiplication accelerator pipelines known as the Matrix Fused Multiply-Add (MFMA).
For a more thorough description of a compute unit on a CDNA accelerator, see An introduction to AMD GPU Programming with HIP, specifically slides 22-28, and Layla Mah’s: The AMD GCN Architecture - A Crash Course, slide 27.
The Pipeline Descriptions section details the various execution pipelines (VALU, SALU, LDS, Scheduler, etc.). The metrics presented by Omniperf for these pipelines are described in Pipeline Metrics section. Finally, the vL1D cache and LDS will be described their own sections.
Pipeline Descriptions
Vector Arithmetic Logic Unit (VALU)
The vector arithmetic logic unit (VALU) executes vector instructions over an entire wavefront, each work-item (or, vector-lane) potentially operating on distinct data. The VALU of a CDNA accelerator or GCN GPU typically consists of:
four 16-wide SIMD processors (see An introduction to AMD GPU Programming with HIP for more details)
four 64 or 128 KiB VGPR files (yielding a total of 256-512 KiB total per CU), see AGPRs for more detail.
An instruction buffer (per-SIMD) that contains execution slots for up to 8 wavefronts (for 32 total wavefront slots on each CU).
A vector memory (VMEM) unit which transfers data between VGPRs and memory; each work-item supplies its own memory address and supplies or receives unique data.
CDNA accelerators, such as the MI100 and MI2XX, contain additional Matrix Fused Multiply-Add (MFMA) units.
In order to support branching / conditionals, each wavefront in the VALU has a distinct execution mask which determines which work-items in the wavefront are active for the currently executing instruction. When executing a VALU instruction, inactive work-items (according to the current execution mask of the wavefront) do not execute the instruction and are treated as no-ops.
Note
On GCN GPUs and the CDNA MI100 accelerator, there are slots for up to 10 wavefronts in the instruction buffer, but generally occupancy is limited by other factors to 32 waves per Compute Unit. On the CDNA2 MI2XX series accelerators, there are only 8 waveslots per-SIMD.
Scalar Arithmetic Logic Unit (SALU)
The scalar arithmetic logic unit (SALU) executes instructions that are shared between all work-items in a wavefront. This includes control-flow – such as if/else conditionals, branches and looping – pointer arithmetic, loading common values, etc. The SALU consists of:
a scalar processor capable of various arithmetic, conditional, and comparison (etc.) operations. See, e.g., Chapter 5. Scalar ALU Operations of the CDNA2 Instruction Set Architecture (ISA) Guide for more detail.
a 12.5 KiB Scalar General Purpose Register (SGPR) file
a scalar memory (SMEM) unit which transfers data between SGPRs and memory
Data loaded by the SMEM can be cached in the scalar L1 data cache, and is typically only used for read-only, uniform accesses such as kernel arguments, or HIP’s __constant__ memory.
Local Data Share (LDS)
The local data share (LDS, a.k.a., “shared memory”) is fast on-CU scratchpad that can be explicitly managed by software to effectively share data and to coordinate between wavefronts in a workgroup.

Performance model of the Local Data Share (LDS) on AMD Instinct™ MI accelerators.
Above is Omniperf’s performance model of the LDS on CDNA accelerators (adapted from GCN Architecture, by Mike Mantor, slide 20). The SIMDs in the VALU are connected to the LDS in pairs (see above). Only one SIMD per pair may issue an LDS instruction at a time, but both pairs may issue concurrently.
On CDNA accelerators, the LDS contains 32 banks and each bank is 4B wide. The LDS is designed such that each bank can be read from/written to/atomically updated every cycle, for a total throughput of 128B/clock (GCN Crash Course, slide 40).
On each of the two ports to the SIMDs, 64B can be sent in each direction per cycle. So, a single wavefront, coming from one of the 2 SIMDs in a pair, can only get back 64B/cycle (16 lanes per cycle). The input port is shared between data and address and this can affect achieved bandwidth for different data sizes. For example, a 64-wide store where each lane is sending a 4B value takes 8 cycles (50% peak bandwidth) while a 64-wide store where each lane is sending a 16B value takes 20 cycles (80% peak bandwidth).
In addition, the LDS contains conflict-resolution hardware to detect and handle bank conflicts. A bank conflict occurs when two (or more) work-items in a wavefront want to read, write, or atomically update different addresses that map to the same bank in the same cycle. In this case, the conflict detection hardware will determine a new schedule such that the access is split into multiple cycles with no conflicts in any single cycle.
When multiple work-items want to read from the same address within a bank, the result can be efficiently broadcasted (GCN Crash Course, slide 41). Multiple work-items writing to the same address within a bank typically results undefined behavior in HIP and other languages, as the LDS will write the value from the last work-item as determined by the hardware scheduler (GCN Crash Course, slide 41). This behavior may be useful in the very specific case of storing a uniform value.
Relatedly, an address conflict is defined as occurring when two (or more) work-items in a wavefront want to atomically update the same address on the same cycle. As in a bank-conflict, this may cause additional cycles of work for the LDS operation to complete.
Branch
The branch unit is responsible for executing jumps and branches to execute control-flow operations. Note that Branch operations are not used for execution mask updates, but only for “whole wavefront” control-flow changes.
Scheduler
The scheduler is responsible for arbitration and issue of instructions for all the wavefronts currently executing on the CU. On every clock cycle, the scheduler:
considers waves from one of the SIMD units for execution, selected in a round-robin fashion between the SIMDs in the compute unit
issues up to one instruction per wavefront on the selected SIMD
issues up to one instruction per each of the instruction categories among the waves on the selected SIMD:
This gives a maximum of five issued Instructions Per Cycle (IPC), per-SIMD, per-CU (AMD GPU HIP Training, GCN Crash Course).
On CDNA accelerators with MFMA instructions, these are issued via the VALU. Some of them will execute on a separate functional unit and typically allow other VALU operations to execute in their shadow (see the MFMA section for more detail).
Note
The IPC model used by Omniperf omits the following two complications for clarity. First, CDNA accelerators contain other execution units on the CU that are unused for compute applications. Second, so-called “internal” instructions (see Layla Mah’s GCN Crash Course, slide 29) are not issued to a functional unit, and can technically cause the maximum IPC to exceed 5 instructions per-cycle in special (largely unrealistic) cases. The latter issue is discussed in more detail in our ‘internal’ IPC example.
Matrix Fused Multiply-Add (MFMA)
CDNA accelerators, such as the MI100 and MI2XX, contain specialized hardware to accelerate matrix-matrix multiplications, also known as Matrix Fused Multiply-Add (MFMA) operations. The exact operation types and supported formats may vary by accelerator. The reader is referred to the AMD matrix cores blog post on GPUOpen for a general discussion of these hardware units. In addition, to explore the available MFMA instructions in-depth on various AMD accelerators (including the CDNA line), we recommend the AMD Matrix Instruction Calculator.
$ ./matrix_calculator.py --architecture cdna2 --instruction v_mfma_f32_4x4x1f32 --detail-instruction
Architecture: CDNA2
Instruction: V_MFMA_F32_4X4X1F32
    Encoding: VOP3P-MAI
    VOP3P Opcode: 0x42
    VOP3P-MAI Opcode: 0x2
    Matrix Dimensions:
        M: 4
        N: 4
        K: 1
        blocks: 16
    Execution statistics:
        FLOPs: 512
        Execution cycles: 8
        FLOPs/CU/cycle: 256
        Can co-execute with VALU: True
        VALU co-execution cycles possible: 4
    Register usage:
        GPRs required for A: 1
        GPRs required for B: 1
        GPRs required for C: 4
        GPRs required for D: 4
        GPR alignment requirement: 8 bytes
For the purposes of Omniperf, the MFMA unit is typically treated as a separate pipeline from the VALU, as other VALU instructions (along with other execution pipelines such as the SALU) can be issued during a portion of the total duration of an MFMA operation.
Note
The exact details of VALU and MFMA operation co-execution vary by instruction, and can be explored in more detail via the:
‘Can co-execute with VALU’
‘VALU co-execution cycles possible’
fields in the AMD Matrix Instruction Calculator’s detailed instruction information.
Non-pipeline resources
In this section, we describe a few resources that are not standalone pipelines but are important for understanding performance optimization on CDNA accelerators.
Barrier
Barriers are resources on the compute-unit of a CDNA accelerator that are used to implement synchronization primitives (e.g., HIP’s __syncthreads).
Barriers are allocated to any workgroup that consists of more than a single wavefront.
Accumulation vector General-Purpose Registers (AGPRs)
Accumulation vector General-Purpose Registers, or AGPRs, are special resources that are accessible to a subset of instructions focused on MFMA operations.
These registers allow the MFMA unit to access more than the normal maximum of 256 architected Vector General-Purpose Registers (i.e., VGPRs) by having up to 256 in the architected space and up to 256 in the accumulation space.
Traditional VALU instructions can only use VGPRs in the architected space, and data can be moved to/from VGPRs↔AGPRs using specialized instructions (v_accvgpr_*).
These data movement instructions may be used by the compiler to implement lower-cost register-spill/fills on architectures with AGPRs.
AGPRs are not available on all AMD Instinct™ accelerators. GCN GPUs, such as the AMD Instinct™ MI50 had a 256 KiB VGPR file. The AMD Instinct™ MI100 (CDNA) has a 2x256 KiB register file, where one half is available as general-purpose VGPRs, and the other half is for matrix math accumulation VGPRs (AGPRs). The AMD Instinct™ MI2XX (CDNA2) has a 512 KiB VGPR file per CU, where each wave can dynamically request up to 256 KiB of VGPRs and an additional 256 KiB of AGPRs. For more detail, the reader is referred to the following comment.
Pipeline Metrics
In this section, we describe the metrics available in Omniperf to analyze the pipelines discussed in the previous section.
Wavefront
Wavefront Launch Stats
The wavefront launch stats panel gives general information about the kernel launch:
Metric |
Description |
Unit |
|---|---|---|
Grid Size |
The total number of work-items (a.k.a “threads”) launched as a part of the kernel dispatch. In HIP, this is equivalent to the total grid size multiplied by the total workgroup (a.k.a “block”) size. |
|
Workgroup Size |
The total number of work-items (a.k.a “threads”) in each workgroup (a.k.a “block”) launched as part of the kernel dispatch. In HIP, this is equivalent to the total block size. |
|
Total Wavefronts |
The total number of wavefronts launched as part of the kernel dispatch. On AMD Instinct™ CDNA accelerators and GCN GPUs, the wavefront size is always 64 work-items. Thus, the total number of wavefronts should be equivalent to the ceiling of Grid Size divided by 64. |
|
Saved Wavefronts |
The total number of wavefronts saved at a context-save, see cwsr_enable. |
|
Restored Wavefronts |
The total number of wavefronts restored from a context-save, see cwsr_enable. |
|
VGPRs |
The number of architected vector general-purpose registers allocated for the kernel, see VALU. Note: this may not exactly match the number of VGPRs requested by the compiler due to allocation granularity. |
|
AGPRs |
The number of accumulation vector general-purpose registers allocated for the kernel, see AGPRs. Note: this may not exactly match the number of AGPRs requested by the compiler due to allocation granularity. |
|
SGPRs |
The number of scalar general-purpose registers allocated for the kernel, see SALU. Note: this may not exactly match the number of SGPRs requested by the compiler due to allocation granularity. |
|
LDS Allocation |
The number of bytes of LDS memory (a.k.a., “Shared” memory) allocated for this kernel. Note: This may also be larger than what was requested at compile-time due to both allocation granularity and dynamic per-dispatch LDS allocations. |
Bytes per workgroup |
Scratch Allocation |
The number of bytes of scratch-memory requested per work-item for this kernel. Scratch memory is used for stack memory on the accelerator, as well as for register spills/restores. |
Bytes per work-item |
Wavefront Runtime Stats
The wavefront runtime statistics gives a high-level overview of the execution of wavefronts in a kernel:
Metric |
Description |
Unit |
|---|---|---|
The total duration of the executed kernel. Note: this should not be directly compared to the wavefront cycles / timings below. |
Nanoseconds |
|
The total duration of the executed kernel in cycles. Note: this should not be directly compared to the wavefront cycles / timings below. |
Cycles |
|
Instructions per wavefront |
The average number of instructions (of all types) executed per wavefront. This is averaged over all wavefronts in a kernel dispatch. |
Instructions / wavefront |
Wave Cycles |
The number of cycles a wavefront in the kernel dispatch spent resident on a compute unit per normalization-unit. This is averaged over all wavefronts in a kernel dispatch. Note: this should not be directly compared to the kernel cycles above. |
Cycles per normalization-unit |
Dependency Wait Cycles |
The number of cycles a wavefront in the kernel dispatch stalled waiting on memory of any kind (e.g., instruction fetch, vector or scalar memory, etc.) per normalization-unit. This counter is incremented at every cycle by all wavefronts on a CU stalled at a memory operation. As such, it is most useful to get a sense of how waves were spending their time, rather than identification of a precise limiter because another wave could be actively executing while a wave is stalled. The sum of this metric, Issue Wait Cycles and Active Cycles should be equal to the total Wave Cycles metric. |
Cycles per normalization-unit |
Issue Wait Cycles |
The number of cycles a wavefront in the kernel dispatch was unable to issue an instruction for any reason (e.g., execution pipe back-pressure, arbitration loss, etc.) per normalization-unit. This counter is incremented at every cycle by all wavefronts on a CU unable to issue an instruction. As such, it is most useful to get a sense of how waves were spending their time, rather than identification of a precise limiter because another wave could be actively executing while a wave is issue stalled. The sum of this metric, Dependency Wait Cycles and Active Cycles should be equal to the total Wave Cycles metric. |
Cycles per normalization-unit |
Active Cycles |
The average number of cycles a wavefront in the kernel dispatch was actively executing instructions per normalization-unit. This measurement is made on a per-wavefront basis, and may include (e.g.,) cycles that another wavefront spent actively executing (e.g., on another execution unit) or was stalled. As such, it is most useful to get a sense of how waves were spending their time, rather than identification of a precise limiter. The sum of this metric, Issue Wait Cycles and Active Wait Cycles should be equal to the total Wave Cycles metric. |
Cycles per normalization-unit |
Wavefront Occupancy |
The time-averaged number of wavefronts resident on the accelerator over the lifetime of the kernel. Note: this metric may be inaccurate for short-running kernels (<< 1ms). |
Wavefronts |
See also
As mentioned above, the measurement of kernel cycles and time typically cannot directly be compared to e.g., Wave Cycles. This is due to two factors: first, the kernel cycles/timings are measured using a counter that is impacted by scheduling overhead, this is particularly noticeable for “short-running” kernels (typically << 1ms) where scheduling overhead forms a significant portion of the overall kernel runtime. Secondly, the Wave Cycles metric is incremented per-wavefront scheduled to a SIMD every cycle whereas the kernel cycles counter is incremented only once per-cycle when any wavefront is scheduled.
Instruction Mix
The instruction mix panel shows a breakdown of the various types of instructions executed by the user’s kernel, and which pipelines on the CU they were executed on. In addition, Omniperf reports further information about the breakdown of operation types for the VALU, vector-memory, and MFMA instructions.
Note
All metrics in this section count instructions issued, and not the total number of operations executed. The values reported by these metrics will not change regardless of the execution mask of the wavefront. We note that even if the execution mask is identically zero (i.e., no lanes are active) the instruction will still be counted, as CDNA accelerators still consider these instructions ‘issued’ see, e.g., EXECute Mask, Section 3.3 of the CDNA2 ISA Guide for more details.
Overall Instruction Mix
This panel shows the total number of each type of instruction issued to the various compute pipelines on the CU. These are:
Metric |
Description |
Unit |
|---|---|---|
VALU Instructions |
The total number of vector arithmetic logic unit (VALU) operations issued. These are the workhorses of the compute-unit, and are used to execute wide range of instruction types including floating point operations, non-uniform address calculations, transcendental operations, integer operations, shifts, conditional evaluation, etc. |
Instructions |
VMEM Instructions |
The total number of vector memory operations issued. These include most loads, stores and atomic operations and all accesses to generic, global, private and texture memory. |
Instructions |
LDS Instructions |
The total number of LDS (a.k.a., “shared memory”) operations issued. These include (e.g.,) loads, stores, atomics, and HIP’s |
Instructions |
MFMA Instructions |
The total number of matrix fused multiply-add instructions issued. |
Instructions |
SALU Instructions |
The total number of scalar arithmetic logic unit (SALU) operations issued. Typically these are used for (e.g.,) address calculations, literal constants, and other operations that are provably uniform across a wavefront. Although scalar memory (SMEM) operations are issued by the SALU, they are counted separately in this section. |
Instructions |
SMEM Instructions |
The total number of scalar memory (SMEM) operations issued. These are typically used for loading kernel arguments, base-pointers and loads from HIP’s |
Instructions |
Branch Instructions |
The total number of branch operations issued. These typically consist of jump / branch operations and are used to implement control flow. |
Instructions |
Note
Note, as mentioned in the Branch section: branch operations are not used for execution mask updates, but only for “whole wavefront” control-flow changes.
VALU Arithmetic Instruction Mix
Warning
Not all metrics in this section (e.g., the floating-point instruction breakdowns) are available on CDNA accelerators older than the MI2XX series.
This panel details the various types of vector instructions that were issued to the VALU. The metrics in this section do not include MFMA instructions using the same precision, e.g. the “F16-ADD” metric does not include any 16-bit floating point additions executed as part of an MFMA instruction using the same precision.
Metric |
Description |
Unit |
|---|---|---|
INT32 |
The total number of instructions operating on 32-bit integer operands issued to the VALU per normalization-unit. |
Instructions per normalization-unit |
INT64 |
The total number of instructions operating on 64-bit integer operands issued to the VALU per normalization-unit. |
Instructions per normalization-unit |
F16-ADD |
The total number of addition instructions operating on 16-bit floating-point operands issued to the VALU per normalization-unit. |
Instructions per normalization-unit |
F16-MUL |
The total number of multiplication instructions operating on 16-bit floating-point operands issued to the VALU per normalization-unit. |
Instructions per normalization-unit |
F16-FMA |
The total number of fused multiply-add instructions operating on 16-bit floating-point operands issued to the VALU per normalization-unit. |
Instructions per normalization-unit |
F16-TRANS |
The total number of transcendental instructions (e.g., |
Instructions per normalization-unit |
F32-ADD |
The total number of addition instructions operating on 32-bit floating-point operands issued to the VALU per normalization-unit. |
Instructions per normalization-unit |
F32-MUL |
The total number of multiplication instructions operating on 32-bit floating-point operands issued to the VALU per normalization-unit. |
Instructions per normalization-unit |
F32-FMA |
The total number of fused multiply-add instructions operating on 32-bit floating-point operands issued to the VALU per normalization-unit. |
Instructions per normalization-unit |
F32-TRANS |
The total number of transcendental instructions (e.g., |
Instructions per normalization-unit |
F64-ADD |
The total number of addition instructions operating on 64-bit floating-point operands issued to the VALU per normalization-unit. |
Instructions per normalization-unit |
F64-MUL |
The total number of multiplication instructions operating on 64-bit floating-point operands issued to the VALU per normalization-unit. |
Instructions per normalization-unit |
F64-FMA |
The total number of fused multiply-add instructions operating on 64-bit floating-point operands issued to the VALU per normalization-unit. |
Instructions per normalization-unit |
F64-TRANS |
The total number of transcendental instructions (e.g., |
Instructions per normalization-unit |
Conversion |
The total number of type conversion instructions (e.g., converting data to/from F32↔F64) issued to the VALU per normalization-unit. |
Instructions per normalization-unit |
For an example of these counters in action, the reader is referred to the VALU Arithmetic Instruction Mix example.
VMEM Instruction Mix
This section breaks down the types of vector memory (VMEM) instructions that were issued. Refer to the Instruction Counts metrics section of address-processor frontend of the vL1D cache for a description of these VMEM instructions.
MFMA Instruction Mix
Warning
The metrics in this section are only available on CDNA2 (MI2XX) accelerators and newer.
This section details the types of Matrix Fused Multiply-Add (MFMA) instructions that were issued. Note that MFMA instructions are classified by the type of input data they operate on, and not the data-type the result is accumulated to.
Metric |
Description |
Unit |
|---|---|---|
MFMA-I8 Instructions |
The total number of 8-bit integer MFMA instructions issued per normalization-unit. |
Instructions per normalization-unit |
MFMA-F16 Instructions |
The total number of 16-bit floating point MFMA instructions issued per normalization-unit. |
Instructions per normalization-unit |
MFMA-BF16 Instructions |
The total number of 16-bit brain floating point MFMA instructions issued per normalization-unit. |
Instructions per normalization-unit |
MFMA-F32 Instructions |
The total number of 32-bit floating-point MFMA instructions issued per normalization-unit. |
Instructions per normalization-unit |
MFMA-F64 Instructions |
The total number of 64-bit floating-point MFMA instructions issued per normalization-unit. |
Instructions per normalization-unit |
Compute Pipeline
FLOP counting conventions
Omniperf’s conventions for VALU FLOP counting are as follows:
Addition or Multiplication: 1 operation
Transcendentals: 1 operation
Fused Multiply-Add (FMA): 2 operations
Integer operations (IOPs) do not use this convention. They are counted as a single operation regardless of the instruction type.
Note
Packed operations which operate on multiple operands in the same instruction are counted identically to the underlying instruction type.
For example, the v_pk_add_f32 instruction on MI2XX, which performs an add operation on two pairs of aligned 32-bit floating-point operands is counted only as a single addition (i.e., 1 operation).
As discussed in the Instruction Mix section, the FLOP/IOP metrics in this section do not take into account the execution mask of the operation, and will report the same value even if the execution mask is identically zero.
For example, a FMA instruction operating on 32-bit floating-point operands (e.g., v_fma_f32 on a MI2XX accelerator) would be counted as 128 total FLOPs: 2 operations (due to the instruction type) multiplied by 64 operations (because the wavefront is composed of 64 work-items).
Compute Speed-of-Light
Warning
The theoretical maximum throughput for some metrics in this section are currently computed with the maximum achievable clock frequency, as reported by rocminfo, for an accelerator. This may not be realistic for all workloads.
This section reports the number of floating-point and integer operations executed on the VALU and MFMA units in various precisions. We note that unlike the VALU instruction mix and MFMA instruction mix sections, the metrics here are reported as FLOPs and IOPs, i.e., the total number of operations executed.
Metric |
Description |
Unit |
|---|---|---|
VALU FLOPs |
The total floating-point operations executed per second on the VALU. This is also presented as a percent of the peak theoretical FLOPs achievable on the specific accelerator. Note: this does not include any floating-point operations from MFMA instructions. |
GFLOPs |
VALU IOPs |
The total integer operations executed per second on the VALU. This is also presented as a percent of the peak theoretical IOPs achievable on the specific accelerator. Note: this does not include any integer operations from MFMA instructions. |
GIOPs |
MFMA FLOPs (BF16) |
The total number of 16-bit brain floating point MFMA operations executed per second. Note: this does not include any 16-bit brain floating point operations from VALU instructions. This is also presented as a percent of the peak theoretical BF16 MFMA operations achievable on the specific accelerator. |
GFLOPs |
MFMA FLOPs (F16) |
The total number of 16-bit floating point MFMA operations executed per second. Note: this does not include any 16-bit floating point operations from VALU instructions. This is also presented as a percent of the peak theoretical F16 MFMA operations achievable on the specific accelerator. |
GFLOPs |
MFMA FLOPs (F32) |
The total number of 32-bit floating point MFMA operations executed per second. Note: this does not include any 32-bit floating point operations from VALU instructions. This is also presented as a percent of the peak theoretical F32 MFMA operations achievable on the specific accelerator. |
GFLOPs |
MFMA FLOPs (F64) |
The total number of 64-bit floating point MFMA operations executed per second. Note: this does not include any 64-bit floating point operations from VALU instructions. This is also presented as a percent of the peak theoretical F64 MFMA operations achievable on the specific accelerator. |
GFLOPs |
MFMA IOPs (INT8) |
The total number of 8-bit integer MFMA operations executed per second. Note: this does not include any 8-bit integer operations from VALU instructions. This is also presented as a percent of the peak theoretical INT8 MFMA operations achievable on the specific accelerator. |
GIOPs |
Pipeline Statistics
This section reports a number of key performance characteristics of various execution units on the CU. The reader is referred to the Instructions per-cycle and Utilizations example for a detailed dive into these metrics, and the scheduler for a high-level overview of execution units and instruction issue.
Metric |
Description |
Unit |
|---|---|---|
IPC |
The ratio of the total number of instructions executed on the CU over the total active CU cycles. |
Instructions per-cycle |
IPC (Issued) |
The ratio of the total number of (non-internal) instructions issued over the number of cycles where the scheduler was actively working on issuing instructions. The reader is recommended the Issued IPC example for further detail. |
Instructions per-cycle |
SALU Utilization |
Indicates what percent of the kernel’s duration the SALU was busy executing instructions. Computed as the ratio of the total number of cycles spent by the scheduler issuing SALU / SMEM instructions over the total CU cycles. |
Percent |
VALU Utilization |
Indicates what percent of the kernel’s duration the VALU was busy executing instructions. Does not include VMEM operations. Computed as the ratio of the total number of cycles spent by the scheduler issuing VALU instructions over the total CU cycles. |
Percent |
VMEM Utilization |
Indicates what percent of the kernel’s duration the VMEM unit was busy executing instructions, including both global/generic and spill/scratch operations (see the VMEM instruction count metrics for more detail). Does not include VALU operations. Computed as the ratio of the total number of cycles spent by the scheduler issuing VMEM instructions over the total CU cycles. |
Percent |
Branch Utilization |
Indicates what percent of the kernel’s duration the Branch unit was busy executing instructions. Computed as the ratio of the total number of cycles spent by the scheduler issuing Branch instructions over the total CU cycles. |
Percent |
VALU Active Threads |
Indicates the average level of divergence within a wavefront over the lifetime of the kernel. The number of work-items that were active in a wavefront during execution of each VALU instruction, time-averaged over all VALU instructions run on all wavefronts in the kernel. |
Work-items |
MFMA Utilization |
Indicates what percent of the kernel’s duration the MFMA unit was busy executing instructions. Computed as the ratio of the total number of cycles spent by the MFMA was busy over the total CU cycles. |
Percent |
MFMA Instruction Cycles |
The average duration of MFMA instructions in this kernel in cycles. Computed as the ratio of the total number of cycles the MFMA unit was busy over the total number of MFMA instructions. Compare to e.g., the AMD Matrix Instruction Calculator. |
Cycles per instruction |
VMEM Latency |
The average number of round-trip cycles (i.e., from issue to data-return / acknowledgment) required for a VMEM instruction to complete. |
Cycles |
SMEM Latency |
The average number of round-trip cycles (i.e., from issue to data-return / acknowledgment) required for a SMEM instruction to complete. |
Cycles |
Note
The Branch utilization reported in this section also includes time spent in other instruction types (namely: s_endpgm) that are typically a very small percentage of the overall kernel execution. This complication is omitted for simplicity, but may result in small amounts of “branch” utilization (<<1%) for otherwise branch-less kernels.
Arithmetic Operations
This section reports the total number of floating-point and integer operations executed in various precisions. Unlike the Compute speed-of-light panel, this section reports both VALU and MFMA operations of the same precision (e.g., F32) in the same metric. Additionally, this panel lets the user control how the data is normalized (i.e., control the normalization-unit), while the speed-of-light panel does not. For more detail on how operations are counted see the FLOP counting convention section.
Warning
As discussed in the Instruction Mix section, the metrics in this section do not take into account the execution mask of the operation, and will report the same value even if EXEC is identically zero.
Metric |
Description |
Unit |
|---|---|---|
FLOPs (Total) |
The total number of floating-point operations executed on either the VALU or MFMA units, per normalization-unit |
FLOP per normalization-unit |
IOPs (Total) |
The total number of integer operations executed on either the VALU or MFMA units, per normalization-unit |
IOP per normalization-unit |
F16 OPs |
The total number of 16-bit floating-point operations executed on either the VALU or MFMA units, per normalization-unit |
FLOP per normalization-unit |
BF16 OPs |
The total number of 16-bit brain floating-point operations executed on either the VALU or MFMA units, per normalization-unit. Note: on current CDNA accelerators, the VALU has no native BF16 instructions. |
FLOP per normalization-unit |
F32 OPs |
The total number of 32-bit floating-point operations executed on either the VALU or MFMA units, per normalization-unit |
FLOP per normalization-unit |
F64 OPs |
The total number of 64-bit floating-point operations executed on either the VALU or MFMA units, per normalization-unit |
FLOP per normalization-unit |
INT8 OPs |
The total number of 8-bit integer operations executed on either the VALU or MFMA units, per normalization-unit. Note: on current CDNA accelerators, the VALU has no native INT8 instructions. |
IOPs per normalization-unit |
Local Data Share (LDS)
LDS Speed-of-Light
Warning
The theoretical maximum throughput for some metrics in this section are currently computed with the maximum achievable clock frequency, as reported by rocminfo, for an accelerator. This may not be realistic for all workloads.
The LDS speed-of-light chart shows a number of key metrics for the LDS as a comparison with the peak achievable values of those metrics. The reader is referred to our previous LDS description for a more in-depth view of the hardware.
Metric |
Description |
Unit |
|---|---|---|
Utilization |
Indicates what percent of the kernel’s duration the LDS was actively executing instructions (including, but not limited to, load, store, atomic and HIP’s |
Percent |
Access Rate |
Indicates the percentage of SIMDs in the VALU1 actively issuing LDS instructions, averaged over the lifetime of the kernel. Calculated as the ratio of the total number of cycles spent by the scheduler issuing LDS instructions over the total CU cycles. |
Percent |
Theoretical Bandwidth (% of Peak) |
Indicates the maximum amount of bytes that could have been loaded from/stored to/atomically updated in the LDS in this kernel, as a percent of the peak LDS bandwidth achievable. See the LDS Bandwidth example for more detail. |
Percent |
Bank Conflict Rate |
Indicates the percentage of active LDS cycles that were spent servicing bank conflicts. Calculated as the ratio of LDS cycles spent servicing bank conflicts over the number of LDS cycles that would have been required to move the same amount of data in an uncontended access.2 |
Percent |
Note
1 Here we assume the typical case where the workload evenly distributes LDS operations over all SIMDs in a CU (that is, waves on different SIMDs are executing similar code). For highly unbalanced workloads, where e.g., one SIMD pair in the CU does not issue LDS instructions at all, this metric is better interpreted as the percentage of SIMDs issuing LDS instructions on SIMD pairs that are actively using the LDS, averaged over the lifetime of the kernel.
2 The maximum value of the bank conflict rate is less than 100% (specifically: 96.875%), as the first cycle in the LDS scheduler is never considered contended.
Statistics
The LDS statistics panel gives a more detailed view of the hardware:
Metric |
Description |
Unit |
|---|---|---|
LDS Instructions |
The total number of LDS instructions (including, but not limited to, read/write/atomics, and e.g., HIP’s |
Instructions per normalization-unit |
Theoretical Bandwidth |
Indicates the maximum amount of bytes that could have been loaded from/stored to/atomically updated in the LDS per normalization-unit. Does not take into account the execution mask of the wavefront when the instruction was executed (see LDS Bandwidth example for more detail). |
Bytes per normalization-unit |
LDS Latency |
The average number of round-trip cycles (i.e., from issue to data-return / acknowledgment) required for an LDS instruction to complete. |
Cycles |
Bank Conflicts/Access |
The ratio of the number of cycles spent in the LDS scheduler due to bank conflicts (as determined by the conflict resolution hardware) to the base number of cycles that would be spent in the LDS scheduler in a completely uncontended case. This is the unnormalized form of the Bank Conflict Rate. |
Conflicts/Access |
Index Accesses |
The total number of cycles spent in the LDS scheduler over all operations per normalization-unit. |
Cycles per normalization-unit |
Atomic Return Cycles |
The total number of cycles spent on LDS atomics with return per normalization-unit. |
Cycles per normalization-unit |
Bank Conflicts |
The total number of cycles spent in the LDS scheduler due to bank conflicts (as determined by the conflict resolution hardware) per normalization-unit. |
Cycles per normalization-unit |
Address Conflicts |
The total number of cycles spent in the LDS scheduler due to address conflicts (as determined by the conflict resolution hardware) per normalization-unit. |
Cycles per normalization-unit |
Unaligned Stall |
The total number of cycles spent in the LDS scheduler due to stalls from non-dword aligned addresses per normalization-unit. |
Cycles per normalization-unit |
Memory Violations |
The total number of out-of-bounds accesses made to the LDS, per normalization-unit. This is unused and expected to be zero in most configurations for modern CDNA accelerators. |
Accesses per normalization-unit |
Vector L1 Cache (vL1D)
The vector L1 data (vL1D) cache is local to each compute unit on the accelerator, and handles vector memory operations issued by a wavefront. The vL1D cache consists of several components:
an address processing unit, also known as the texture addresser (TA), which receives commands (e.g., instructions) and write/atomic data from the Compute Unit, and coalesces them into fewer requests for the cache to process.
an address translation unit, also known as the L1 Unified Translation Cache (UTCL1), that translates requests from virtual to physical addresses for lookup in the cache. The translation unit has an L1 translation lookaside buffer (L1TLB) to reduce the cost of repeated translations.
a Tag RAM that looks up whether a requested cache line is already present in the cache.
the result of the Tag RAM lookup is placed in the L1 cache controller for routing to the correct location, e.g., the L2 Memory Interface for misses or the Cache RAM for hits.
the Cache RAM, also known as the texture cache (TC), stores requested data for potential reuse. Data returned from the L2 cache is placed into the Cache RAM before going down the data-return path.
a backend data processing unit, also known as the texture data (TD) that routes data back to the requesting Compute Unit.
Together, this complex is known as the vL1D, or Texture Cache per Pipe (TCP). A simplified diagram of the vL1D is presented below:

Performance model of the vL1D Cache on AMD Instinct™ MI accelerators.
vL1D Speed-of-Light
Warning
The theoretical maximum throughput for some metrics in this section are currently computed with the maximum achievable clock frequency, as reported by rocminfo, for an accelerator. This may not be realistic for all workloads.
The vL1D’s speed-of-light chart shows several key metrics for the vL1D as a comparison with the peak achievable values of those metrics.
Metric |
Description |
Unit |
|---|---|---|
Hit Rate |
The ratio of the number of vL1D cache line requests that hit1 in vL1D cache over the total number of cache line requests to the vL1D Cache RAM. |
Percent |
Bandwidth |
The number of bytes looked up in the vL1D cache as a result of VMEM instructions, as a percent of the peak theoretical bandwidth achievable on the specific accelerator. The number of bytes is calculated as the number of cache lines requested multiplied by the cache line size. This value does not consider partial requests, so e.g., if only a single value is requested in a cache line, the data movement will still be counted as a full cache line. |
Percent |
Utilization |
Indicates how busy the vL1D Cache RAM was during the kernel execution. The number of cycles where the vL1D Cache RAM is actively processing any request divided by the number of cycles where the vL1D is active2 |
Percent |
Coalescing |
Indicates how well memory instructions were coalesced by the address processing unit, ranging from uncoalesced (25%) to fully coalesced (100%). The average number of thread-requests generated per instruction divided by the ideal number of thread-requests per instruction. |
Percent |
Note
1 The vL1D cache on AMD Instinct™ MI CDNA accelerators uses a “hit-on-miss” approach to reporting cache hits. That is, if while satisfying a miss, another request comes in that would hit on the same pending cache line, the subsequent request will be counted as a ‘hit’. Therefore, it is also important to consider the Access Latency metric in the Cache access metrics section when evaluating the vL1D hit rate.
2 Omniperf considers the vL1D to be active when any part of the vL1D (excluding the address-processor and data-return units) are active, e.g., performing a translation, waiting for data, accessing the Tag or Cache RAMs, etc.
Address Processing Unit or Texture Addresser (TA)
The vL1D’s address processing unit receives vector memory instructions (commands) along with write/atomic data from a Compute Unit and is responsible for coalescing these into requests for lookup in the vL1D RAM. The address processor passes information about the commands (coalescing state, destination SIMD, etc.) to the data processing unit for use after the requested data has been retrieved.
Omniperf reports several metrics to indicate performance bottlenecks in the address processing unit, which are broken down into a few categories:
Busy / stall metrics
Instruction counts
Spill / Stack metrics
Busy / Stall metrics
When executing vector memory instructions, the compute unit must send an address (and in the case of writes/atomics, data) to the address processing unit. When the frontend cannot accept any more addresses, it must backpressure the wave-issue logic for the VMEM pipe and prevent the issue of a vector memory instruction until a previously issued memory operation has been processed.
Metric |
Description |
Unit |
|---|---|---|
Busy |
Percent of the total CU cycles the address processor was busy |
Percent |
Address Stall |
Percent of the total CU cycles the address processor was stalled from sending address requests further into the vL1D pipeline |
Percent |
Data Stall |
Percent of the total CU cycles the address processor was stalled from sending write/atomic data further into the vL1D pipeline |
Percent |
Data-Processor → Address Stall |
Percent of total CU cycles the address processor was stalled waiting to send command data to the data processor |
Percent |
Instruction counts
The address processor also counts instruction types to give the user information on what sorts of memory instructions were executed by the kernel. These are broken down into a few major categories:
Memory type |
Usage |
Description |
|---|---|---|
Global |
Global memory |
Global memory can be seen by all threads from a process. This includes the local accelerator’s DRAM, remote accelerator’s DRAM, and the host’s DRAM. |
Generic |
Dynamic address spaces |
Generic memory, a.k.a. “flat” memory, is used when the compiler cannot statically prove that a pointer is to memory in one or the other address spaces. The pointer could dynamically point into global, local, constant, or private memory. |
Private Memory |
Register spills / Stack memory |
Private memory, a.k.a. “scratch” memory, is only visible to a particular work-item in a particular workgroup. On AMD Instinct™ MI accelerators, private memory is used to implement both register spills and stack memory accesses. |
The address processor counts these instruction types as follows:
Type |
Description |
Unit |
|---|---|---|
Global/Generic |
The total number of global & generic memory instructions executed on all compute units on the accelerator, per normalization-unit. |
Instructions per normalization-unit |
Global/Generic Read |
The total number of global & generic memory read instructions executed on all compute units on the accelerator, per normalization-unit. |
Instructions per normalization-unit |
Global/Generic Write |
The total number of global & generic memory write instructions executed on all compute units on the accelerator, per normalization-unit. |
Instructions per normalization-unit |
Global/Generic Atomic |
The total number of global & generic memory atomic (with and without return) instructions executed on all compute units on the accelerator, per normalization-unit. |
Instructions per normalization-unit |
Spill/Stack |
The total number of spill/stack memory instructions executed on all compute units on the accelerator, per normalization-unit. |
Instructions per normalization-unit |
Spill/Stack Read |
The total number of spill/stack memory read instructions executed on all compute units on the accelerator, per normalization-unit. |
Instructions per normalization-unit |
Spill/Stack Write |
The total number of spill/stack memory write instructions executed on all compute units on the accelerator, per normalization-unit. |
Instruction per normalization-unit |
Spill/Stack Atomic |
The total number of spill/stack memory atomic (with and without return) instructions executed on all compute units on the accelerator, per normalization-unit. Typically unused as these memory operations are typically used to implement thread-local storage. |
Instructions per normalization-unit |
Note
The above is a simplified model specifically for the HIP programming language that does not consider (e.g.,) inline assembly usage, constant memory usage or texture memory.
These categories correspond to:
Global/Generic: global and flat memory operations, that are used for Global and Generic memory access.
Spill/Stack: buffer instructions which are used on the MI50, MI100, and MI2XX accelerators for register spills / stack memory.
These concepts are described in more detail in the memory space section below, while generic memory access is explored in the generic memory benchmark section.
Spill/Stack metrics
Finally, the address processing unit contains a separate coalescing stage for spill/stack memory, and thus reports:
Metric |
Description |
Unit |
|---|---|---|
Spill/Stack Total Cycles |
The number of cycles the address processing unit spent working on spill/stack instructions, per normalization-unit. |
Cycles per normalization-unit |
Spill/Stack Coalesced Read Cycles |
The number of cycles the address processing unit spent working on coalesced spill/stack read instructions, per normalization-unit. |
Cycles per normalization-unit |
Spill/Stack Coalesced Write Cycles |
The number of cycles the address processing unit spent working on coalesced spill/stack write instructions, per normalization-unit |
Cycles per normalization-unit |
L1 Unified Translation Cache (UTCL1)
After a vector memory instruction has been processed/coalesced by the address processing unit of the vL1D, it must be translated from a virtual to physical address. This process is handled by the L1 Unified Translation Cache (UTCL1). This cache contains a L1 Translation Lookaside Buffer (TLB) which stores recently translated addresses to reduce the cost of subsequent re-translations.
Omniperf reports the following L1 TLB metrics:
Metric |
Description |
Unit |
|---|---|---|
Requests |
The number of translation requests made to the UTCL1 per normalization-unit. |
Requests per normalization-unit |
Hits |
The number of translation requests that hit in the UTCL1, and could be reused, per normalization-unit. |
Requests per normalization-unit |
Hit Ratio |
The ratio of the number of translation requests that hit in the UTCL1 divided by the total number of translation requests made to the UTCL1. |
Percent |
Translation Misses |
The total number of translation requests that missed in the UTCL1 due to translation not being present in the cache, per normalization-unit. |
Requests per normalization-unit |
Permission Misses |
The total number of translation requests that missed in the UTCL1 due to a permission error, per normalization-unit. This is unused and expected to be zero in most configurations for modern CDNA accelerators. |
Requests per normalization-unit |
Note
On current CDNA accelerators, such as the MI2XX, the UTCL1 does not count hit-on-miss requests.
Vector L1 Cache RAM (TC)
After coalescing in the address processing unit of the v1LD, and address translation in the L1 TLB the request proceeds to the Cache RAM stage of the pipeline. Incoming requests are looked up in the cache RAMs using parts of the physical address as a tag. Hits will be returned through the data-return path, while misses will routed out to the L2 Cache for servicing.
The metrics tracked by the vL1D RAM include:
Stall metrics
Cache access metrics
vL1D-L2 transaction detail metrics
vL1D cache stall metrics
The vL1D also reports where it is stalled in the pipeline, which may indicate performance limiters of the cache. A stall in the pipeline may result in backpressuring earlier parts of the pipeline, e.g., a stall on L2 requests may backpressure the wave-issue logic of the VMEM pipe and prevent it from issuing more vector memory instructions until the vL1D’s outstanding requests are completed.
Metric |
Description |
Unit |
|---|---|---|
Stalled on L2 Data |
The ratio of the number of cycles where the vL1D is stalled waiting for requested data to return from the L2 cache divided by the number of cycles where the vL1D is active. |
Percent |
Stalled on L2 Requests |
The ratio of the number of cycles where the vL1D is stalled waiting to issue a request for data to the L2 cache divided by the number of cycles where the vL1D is active. |
Percent |
Tag RAM Stall (Read/Write/Atomic) |
The ratio of the number of cycles where the vL1D is stalled due to Read/Write/Atomic requests with conflicting tags being looked up concurrently, divided by the number of cycles where the vL1D is active. |
Percent |
vL1D cache access metrics
The vL1D cache access metrics broadly indicate the type of requests incoming from the cache frontend, the number of requests that were serviced by the vL1D, and the number & type of outgoing requests to the L2 cache. In addition, this section includes the approximate latencies of accesses to the cache itself, along with latencies of read/write memory operations to the L2 cache.
Metric |
Description |
Unit |
|---|---|---|
Total Requests |
The total number of incoming requests from the address processing unit after coalescing. |
Requests |
Total read/write/atomic requests |
The total number of incoming read/write/atomic requests from the address processing unit after coalescing per normalization-unit. |
Requests per normalization-unit |
Cache Bandwidth |
The number of bytes looked up in the vL1D cache as a result of VMEM instructions per normalization-unit. The number of bytes is calculated as the number of cache lines requested multiplied by the cache line size. This value does not consider partial requests, so e.g., if only a single value is requested in a cache line, the data movement will still be counted as a full cache line. |
Bytes per normalization-unit |
Cache Hit Rate |
The ratio of the number of vL1D cache line requests that hit in vL1D cache over the total number of cache line requests to the vL1D Cache RAM. |
Percent |
Cache Accesses |
The total number of cache line lookups in the vL1D. |
Cache lines |
Cache Hits |
The number of cache accesses minus the number of outgoing requests to the L2 cache, i.e., the number of cache line requests serviced by the vL1D Cache RAM per normalization-unit. |
Cache lines per normalization-unit |
Invalidations |
The number of times the vL1D was issued a write-back invalidate command during the kernel’s execution per normalization-unit. This may be triggered by, e.g., the |
Invalidations per normalization-unit |
L1-L2 Bandwidth |
The number of bytes transferred across the vL1D-L2 interface as a result of VMEM instructions, per normalization-unit. The number of bytes is calculated as the number of cache lines requested multiplied by the cache line size. This value does not consider partial requests, so e.g., if only a single value is requested in a cache line, the data movement will still be counted as a full cache line. |
Bytes per normalization-unit |
L1-L2 Reads |
The number of read requests for a vL1D cache line that were not satisfied by the vL1D and must be retrieved from the to the L2 Cache per normalization-unit. |
Requests per normalization-unit |
L1-L2 Writes |
The number of post-coalescing write requests that are sent through the vL1D to the L2 cache, per normalization-unit. |
Requests per normalization-unit |
L1-L2 Atomics |
The number of atomic requests that are sent through the vL1D to the L2 cache, per normalization-unit. This includes requests for atomics with, and without return. |
Requests per normalization-unit |
L1 Access Latency |
The average number of cycles that a vL1D cache line request spent in the vL1D cache pipeline. |
Cycles |
L1-L2 Read Access Latency |
The average number of cycles that the vL1D cache took to issue and receive read requests from the L2 Cache. This number also includes requests for atomics with return values. |
Cycles |
L1-L2 Write Access Latency |
The average number of cycles that the vL1D cache took to issue and receive acknowledgement of a write request to the L2 Cache. This number also includes requests for atomics without return values. |
Cycles |
Note
All cache accesses in vL1D are for a single cache line’s worth of data. The size of a cache line may vary, however on current AMD Instinct™ MI CDNA accelerators and GCN GPUs the L1 cache line size is 64B.
vL1D - L2 Transaction Detail
This section provides a more granular look at the types of requests made to the L2 cache. These are broken down by the operation type (read / write / atomic, with, or without return), and the memory type. For more detail, the reader is referred to the Memory Types section.
Vector L1 Data-Return Path or Texture Data (TD)
The data-return path of the vL1D cache, also known as the Texture Data (TD) unit, is responsible for routing data returned from the vL1D cache RAM back to a wavefront on a SIMD. As described in the vL1D cache front-end section, the data-return path is passed information about the space requirements and routing for data requests from the VALU. When data is returned from the vL1D cache RAM, it is matched to this previously stored request data, and returned to the appropriate SIMD.
Omniperf reports the following vL1D data-return path metrics:
Metric |
Description |
Unit |
|---|---|---|
Data-return Busy |
Percent of the total CU cycles the data-return unit was busy processing or waiting on data to return to the CU. |
Percent |
Cache RAM → Data-return Stall |
Percent of the total CU cycles the data-return unit was stalled on data to be returned from the vL1D Cache RAM. |
Percent |
Workgroup manager → Data-return Stall |
Percent of the total CU cycles the data-return unit was stalled by the workgroup manager due to initialization of registers as a part of launching new workgroups. |
Percent |
Coalescable Instructions |
The number of instructions submitted to the data-return unit by the address-processor that were found to be coalescable, per normalization-unit. |
Instructions per normalization-unit |
Read Instructions |
The number of read instructions submitted to the data-return unit by the address-processor summed over all compute units on the accelerator, per normalization-unit. This is expected to be the sum of global/generic and spill/stack reads in the address processor. |
Instructions per normalization-unit |
Write Instructions |
The number of store instructions submitted to the data-return unit by the address-processor summed over all compute units on the accelerator, per normalization-unit. This is expected to be the sum of global/generic and spill/stack stores counted by the vL1D cache-frontend. |
Instructions per normalization-unit |
Atomic Instructions |
The number of atomic instructions submitted to the data-return unit by the address-processor summed over all compute units on the accelerator, per normalization-unit. This is expected to be the sum of global/generic and spill/stack atomics in the address processor. |
Instructions per normalization-unit |
L2 Cache (TCC)
The L2 cache is the coherence point for current AMD Instinct™ MI GCN GPUs and CDNA accelerators, and is shared by all compute units on the device. Besides serving requests from the vector L1 data caches, the L2 cache also is responsible for servicing requests from the L1 instruction caches, the scalar L1 data caches and the command-processor. The L2 cache is composed of a number of distinct channels (32 on MI100/MI2XX series CDNA accelerators at 256B address interleaving) which can largely operate independently. Mapping of incoming requests to a specific L2 channel is determined by a hashing mechanism that attempts to evenly distribute requests across the L2 channels. Requests that miss in the L2 cache are passed out to Infinity Fabric™ to be routed to the appropriate memory location.
The L2 cache metrics reported by Omniperf are broken down into four categories:
L2 Speed-of-Light
L2 Cache Accesses
L2-Fabric Transactions
L2-Fabric Stalls
L2 Speed-of-Light
Warning
The theoretical maximum throughput for some metrics in this section are currently computed with the maximum achievable clock frequency, as reported by rocminfo, for an accelerator. This may not be realistic for all workloads.
The L2 cache’s speed-of-light table contains a few key metrics about the performance of the L2 cache, aggregated over all the L2 channels, as a comparison with the peak achievable values of those metrics:
Metric |
Description |
Unit |
|---|---|---|
Utilization |
The ratio of the number of cycles an L2 channel was active, summed over all L2 channels on the accelerator over the total L2 cycles. |
Percent |
Bandwidth |
The number of bytes looked up in the L2 cache, as a percent of the peak theoretical bandwidth achievable on the specific accelerator. The number of bytes is calculated as the number of cache lines requested multiplied by the cache line size. This value does not consider partial requests, so e.g., if only a single value is requested in a cache line, the data movement will still be counted as a full cache line. |
Percent |
Hit Rate |
The ratio of the number of L2 cache line requests that hit in the L2 cache over the total number of incoming cache line requests to the L2 cache. |
Percent |
L2-Fabric Read BW |
The number of bytes read by the L2 over the Infinity Fabric™ interface per unit time. |
GB/s |
L2-Fabric Write and Atomic BW |
The number of bytes sent by the L2 over the Infinity Fabric™ interface by write and atomic operations per unit time. |
GB/s |
Note
The L2 cache on AMD Instinct™ MI CDNA accelerators uses a “hit-on-miss” approach to reporting cache hits. That is, if while satisfying a miss, another request comes in that would hit on the same pending cache line, the subsequent request will be counted as a ‘hit’. Therefore, it is also important to consider the latency metric in the L2-Fabric section when evaluating the L2 hit rate.
L2 Cache Accesses
This section details the incoming requests to the L2 cache from the vL1D and other clients (e.g., the sL1D and L1I caches).
Metric |
Description |
Unit |
|---|---|---|
Bandwidth |
The number of bytes looked up in the L2 cache, per normalization-unit. The number of bytes is calculated as the number of cache lines requested multiplied by the cache line size. This value does not consider partial requests, so e.g., if only a single value is requested in a cache line, the data movement will still be counted as a full cache line. |
Bytes per normalization-unit |
Requests |
The total number of incoming requests to the L2 from all clients for all request types, per normalization-unit. |
Requests per normalization-unit |
Read Requests |
The total number of read requests to the L2 from all clients. |
Requests per normalization-unit |
Write Requests |
The total number of write requests to the L2 from all clients. |
Requests per normalization-unit |
Atomic Requests |
The total number of atomic requests (with and without return) to the L2 from all clients. |
Requests per normalization-unit |
Streaming Requests |
The total number of incoming requests to the L2 that are marked as ‘streaming’. The exact meaning of this may differ depending on the targeted accelerator, however on an MI2XX this corresponds to non-temporal load or stores. The L2 cache attempts to evict ‘streaming’ requests before normal requests when the L2 is at capacity. |
Requests per normalization-unit |
Probe Requests |
The number of coherence probe requests made to the L2 cache from outside the accelerator. On an MI2XX, probe requests may be generated by e.g., writes to fine-grained device memory or by writes to coarse-grained device memory. |
Requests per normalization-unit |
Hit Rate |
The ratio of the number of L2 cache line requests that hit in the L2 cache over the total number of incoming cache line requests to the L2 cache. |
Percent |
Hits |
The total number of requests to the L2 from all clients that hit in the cache. As noted in the speed-of-light section, this includes hit-on-miss requests. |
Requests per normalization-unit |
Misses |
The total number of requests to the L2 from all clients that miss in the cache. As noted in the speed-of-light section, these do not include hit-on-miss requests. |
Requests per normalization-unit |
Writebacks |
The total number of L2 cache lines written back to memory for any reason. Write-backs may occur due to e.g., user-code (e.g., HIP kernel calls to |
Cache lines per normalization-unit |
Writebacks (Internal) |
The total number of L2 cache lines written back to memory for internal hardware reasons, per normalization-unit. |
Cache lines per normalization-unit |
Writebacks (vL1D Req) |
The total number of L2 cache lines written back to memory due to requests initiated by the vL1D cache, per normalization-unit. |
Cache lines per normalization-unit |
Evictions (Normal) |
The total number of L2 cache lines evicted from the cache due to capacity limits, per normalization-unit, per normalization-unit. |
Cache lines per normalization-unit |
Evictions (vL1D Req) |
The total number of L2 cache lines evicted from the cache due to invalidation requests initiated by the vL1D cache, per normalization-unit. |
Cache lines per normalization-unit |
Non-hardware-Coherent Requests |
The total number of requests to the L2 to Not-hardware-Coherent (NC) memory allocations, per normalization-unit. See the Memory Types section for more detail. |
Requests per normalization-unit |
Uncached Requests |
The total number of requests to the L2 that to uncached (UC) memory allocations. See the Memory Types section for more detail. |
Requests per normalization-unit |
Coherently Cached Requests |
The total number of requests to the L2 that to coherently cachable (CC) memory allocations. See the Memory Types section for more detail. |
Requests per normalization-unit |
Read/Write Coherent Requests |
The total number of requests to the L2 that to Read-Write coherent memory (RW) allocations. See the Memory Types section for more detail. |
Requests per normalization-unit |
Note
All requests to the L2 are for a single cache line’s worth of data. The size of a cache line may vary depending on the accelerator, however on an AMD Instinct™ CDNA2 MI2XX accelerator, it is 128B, while on an MI100, it is 64B.
L2-Fabric transactions
Requests/data that miss in the L2 must be routed to memory in order to service them. The backing memory for a request may be local to this accelerator (i.e., in the local high-bandwidth memory), in a remote accelerator’s memory, or even in the CPU’s memory. Infinity Fabric™ is responsible for routing these memory requests/data to the correct location and returning any fetched data to the L2 cache. The following section describes the flow of these requests through Infinity Fabric™ in more detail, as described by Omniperf metrics, while later sections give detailed definitions of individual metrics.
Request flow
Below is a diagram that illustrates how L2↔Fabric requests are reported by Omniperf:

L2↔Fabric transaction flow on AMD Instinct™ MI accelerators.
Requests from the L2 Cache are broken down into two major categories, read requests and write requests (at this granularity, atomic requests are treated as writes).
From there, these requests can additionally subdivided in a number of ways. First, these requests may be sent across Infinity Fabric™ as different transaction sizes, 32B or 64B on current CDNA accelerators.
Note
On current CDNA accelerators, the 32B read request path is expected to be unused (hence: is disconnected in the flow diagram).
In addition, the read and write requests can be further categorized as:
uncached read/write requests, e.g., for accesses to fine-grained memory
atomic requests, e.g., for atomic updates to fine-grained memory
HBM read/write requests OR remote read/write requests, i.e., for requests to the accelerator’s local HBM OR requests to a remote accelerator’s HBM / the CPU’s DRAM.
These classifications are not necessarily exclusive, for example, a write request can be classified as an atomic request to the accelerator’s local HBM, and an uncached write request. The request-flow diagram marks exclusive classifications as a splitting of the flow, while non-exclusive requests do not split the flow line. For example, a request is either a 32B Write Request OR a 64B Write request, as the flow splits at this point:

Splitting request flow
However, continuing along, the same request might be an Atomic request and an Uncached Write request, as reflected by a non-split flow:

Non-splitting request flow
Finally, we note that uncached read requests (e.g., to fine-grained memory) are handled specially on CDNA accelerators, as indicated in the request flow diagram. These are expected to be counted as a 64B Read Request, and if they are requests to uncached memory (denoted by the dashed line), they will also be counted as two uncached read requests (i.e., the request is split):

Uncached read-request splitting.
Metrics
The following metrics are reported for the L2-Fabric interface:
Metric |
Description |
Unit |
|---|---|---|
L2-Fabric Read Bandwidth |
The total number of bytes read by the L2 cache from Infinity Fabric™ per normalization-unit. |
Bytes per normalization-unit |
HBM Read Traffic |
The percent of read requests generated by the L2 cache that are routed to the accelerator’s local high-bandwidth memory (HBM). This breakdown does not consider the size of the request (i.e., 32B and 64B requests are both counted as a single request), so this metric only approximates the percent of the L2-Fabric Read bandwidth directed to the local HBM. |
Percent |
Remote Read Traffic |
The percent of read requests generated by the L2 cache that are routed to any memory location other than the accelerator’s local high-bandwidth memory (HBM) — e.g., the CPU’s DRAM, a remote accelerator’s HBM, etc. This breakdown does not consider the size of the request (i.e., 32B and 64B requests are both counted as a single request), so this metric only approximates the percent of the L2-Fabric Read bandwidth directed to a remote location. |
Percent |
Uncached Read Traffic |
The percent of read requests generated by the L2 cache that are reading from an uncached memory allocation. Note, as described in the request-flow section, a single 64B read request is typically counted as two uncached read requests, hence it is possible for the Uncached Read Traffic to reach up to 200% of the total number of read requests. This breakdown does not consider the size of the request (i.e., 32B and 64B requests are both counted as a single request), so this metric only approximates the percent of the L2-Fabric read bandwidth directed to an uncached memory location. |
Percent |
L2-Fabric Write and Atomic Bandwidth |
The total number of bytes written by the L2 over Infinity Fabric™ by write and atomic operations per normalization-unit. Note that on current CDNA accelerators, such as the MI2XX, requests are only considered ‘atomic’ by Infinity Fabric™ if they are targeted at non-write-cachable memory, e.g., fine-grained memory allocations or uncached memory allocations on the MI2XX. |
Bytes per normalization-unit |
HBM Write and Atomic Traffic |
The percent of write and atomic requests generated by the L2 cache that are routed to the accelerator’s local high-bandwidth memory (HBM). This breakdown does not consider the size of the request (i.e., 32B and 64B requests are both counted as a single request), so this metric only approximates the percent of the L2-Fabric Write and Atomic bandwidth directed to the local HBM. Note that on current CDNA accelerators, such as the MI2XX, requests are only considered ‘atomic’ by Infinity Fabric™ if they are targeted at fine-grained memory allocations or uncached memory allocations. |
Percent |
Remote Write and Atomic Traffic |
The percent of write and atomic requests generated by the L2 cache that are routed to any memory location other than the accelerator’s local high-bandwidth memory (HBM) — e.g., the CPU’s DRAM, a remote accelerator’s HBM, etc. This breakdown does not consider the size of the request (i.e., 32B and 64B requests are both counted as a single request), so this metric only approximates the percent of the L2-Fabric Write and Atomic bandwidth directed to a remote location. Note that on current CDNA accelerators, such as the MI2XX, requests are only considered ‘atomic’ by Infinity Fabric™ if they are targeted at non-write-cachable memory, e.g., fine-grained memory allocations or uncached memory allocations on the MI2XX. |
Percent |
Atomic Traffic |
The percent of write requests generated by the L2 cache that are atomic requests to any memory location. This breakdown does not consider the size of the request (i.e., 32B and 64B requests are both counted as a single request), so this metric only approximates the percent of the L2-Fabric Write and Atomic bandwidth that is due to use of atomics. Note that on current CDNA accelerators, such as the MI2XX, requests are only considered ‘atomic’ by Infinity Fabric™ if they are targeted at fine-grained memory allocations or uncached memory allocations. |
Percent |
Uncached Write and Atomic Traffic |
The percent of write and atomic requests generated by the L2 cache that are targeting uncached memory allocations. This breakdown does not consider the size of the request (i.e., 32B and 64B requests are both counted as a single request), so this metric only approximates the percent of the L2-Fabric read bandwidth directed to uncached memory allocations. |
Percent |
Read Latency |
The time-averaged number of cycles read requests spent in Infinity Fabric™ before data was returned to the L2. |
Cycles |
Write Latency |
The time-averaged number of cycles write requests spent in Infinity Fabric™ before a completion acknowledgement was returned to the L2. |
Cycles |
Atomic Latency |
The time-averaged number of cycles atomic requests spent in Infinity Fabric™ before a completion acknowledgement (atomic without return value) or data (atomic with return value) was returned to the L2. |
Cycles |
Read Stall |
The ratio of the total number of cycles the L2-Fabric interface was stalled on a read request to any destination (local HBM, remote PCIe® connected accelerator / CPU, or remote Infinity Fabric™ connected accelerator1 / CPU) over the total active L2 cycles. |
Percent |
Write Stall |
The ratio of the total number of cycles the L2-Fabric interface was stalled on a write or atomic request to any destination (local HBM, remote accelerator / CPU, PCIe® connected accelerator / CPU, or remote Infinity Fabric™ connected accelerator1 / CPU) over the total active L2 cycles. |
Percent |
Detailed Transaction Metrics
The following metrics are available in the detailed L2-Fabric transaction breakdown table:
Metric |
Description |
Unit |
|---|---|---|
32B Read Requests |
The total number of L2 requests to Infinity Fabric™ to read 32B of data from any memory location, per normalization-unit. See request-flow for more detail. Typically unused on CDNA accelerators. |
Requests per normalization-unit |
Uncached Read Requests |
The total number of L2 requests to Infinity Fabric™ to read uncached data from any memory location, per normalization-unit. 64B requests for uncached data are counted as two 32B uncached data requests. See request-flow for more detail. |
Requests per normalization-unit |
64B Read Requests |
The total number of L2 requests to Infinity Fabric™ to read 64B of data from any memory location, per normalization-unit. See request-flow for more detail. |
Requests per normalization-unit |
HBM Read Requests |
The total number of L2 requests to Infinity Fabric™ to read 32B or 64B of data from the accelerator’s local HBM, per normalization-unit. See request-flow for more detail. |
Requests per normalization-unit |
Remote Read Requests |
The total number of L2 requests to Infinity Fabric™ to read 32B or 64B of data from any source other than the accelerator’s local HBM, per normalization-unit. See request-flow for more detail. |
Requests per normalization-unit |
32B Write and Atomic Requests |
The total number of L2 requests to Infinity Fabric™ to write or atomically update 32B of data to any memory location, per normalization-unit. See request-flow for more detail. |
Requests per normalization-unit |
Uncached Write and Atomic Requests |
The total number of L2 requests to Infinity Fabric™ to write or atomically update 32B or 64B of uncached data, per normalization-unit. See request-flow for more detail. |
Requests per normalization-unit |
64B Write and Atomic Requests |
The total number of L2 requests to Infinity Fabric™ to write or atomically update 64B of data in any memory location, per normalization-unit. See request-flow for more detail. |
Requests per normalization-unit |
HBM Write and Atomic Requests |
The total number of L2 requests to Infinity Fabric™ to write or atomically update 32B or 64B of data in the accelerator’s local HBM, per normalization-unit. See request-flow for more detail. |
Requests per normalization-unit |
Remote Write and Atomic Requests |
The total number of L2 requests to Infinity Fabric™ to write or atomically update 32B or 64B of data in any memory location other than the accelerator’s local HBM, per normalization-unit. See request-flow for more detail. |
Requests per normalization-unit |
Atomic Requests |
The total number of L2 requests to Infinity Fabric™ to atomically update 32B or 64B of data in any memory location, per normalization-unit. See request-flow for more detail. Note that on current CDNA accelerators, such as the MI2XX, requests are only considered ‘atomic’ by Infinity Fabric™ if they are targeted at non-write-cachable memory, e.g., fine-grained memory allocations or uncached memory allocations on the MI2XX. |
Requests per normalization-unit |
L2-Fabric Interface Stalls
When the interface between the L2 cache and Infinity Fabric™ becomes backed up by requests, it may stall preventing the L2 from issuing additional requests to Infinity Fabric™ until prior requests complete. This section gives a breakdown of what types of requests in a kernel caused a stall (e.g., read vs write), and to which locations (e.g., to the accelerator’s local memory, or to remote accelerators/CPUs).
Metric |
Description |
Unit |
|---|---|---|
Read - PCIe® Stall |
The number of cycles the L2-Fabric interface was stalled on read requests to remote PCIe® connected accelerators1 or CPUs as a percent of the total active L2 cycles. |
Percent |
Read - Infinity Fabric™ Stall |
The number of cycles the L2-Fabric interface was stalled on read requests to remote Infinity Fabric™ connected accelerators1 or CPUs as a percent of the total active L2 cycles. |
Percent |
Read - HBM Stall |
The number of cycles the L2-Fabric interface was stalled on read requests to the accelerator’s local HBM as a percent of the total active L2 cycles. |
Percent |
Write - PCIe® Stall |
The number of cycles the L2-Fabric interface was stalled on write or atomic requests to remote PCIe® connected accelerators1 or CPUs as a percent of the total active L2 cycles. |
Percent |
Write - Infinity Fabric™ Stall |
The number of cycles the L2-Fabric interface was stalled on write or atomic requests to remote Infinity Fabric™ connected accelerators1 or CPUs as a percent of the total active L2 cycles. |
Percent |
Write - HBM Stall |
The number of cycles the L2-Fabric interface was stalled on write or atomic requests to accelerator’s local HBM as a percent of the total active L2 cycles. |
Percent |
Write - Credit Starvation |
The number of cycles the L2-Fabric interface was stalled on write or atomic requests to any memory location because too many write/atomic requests were currently in flight, as a percent of the total active L2 cycles. |
Percent |
Note
1 In addition to being used for on-accelerator data-traffic, AMD Infinity Fabric™ technology can be used to connect multiple accelerators to achieve advanced peer-to-peer connectivity and enhanced bandwidths over traditional PCIe® connections. Some AMD Instinct™ MI accelerators, e.g., the MI250X, feature coherent CPU↔accelerator connections built using AMD Infinity Fabric™
Warning
On current CDNA accelerators and GCN GPUs, these L2↔Fabric stalls can be undercounted in some circumstances.
Shader Engine (SE)
The CUs on a CDNA accelerator are grouped together into a higher-level organizational unit called a Shader Engine (SE):
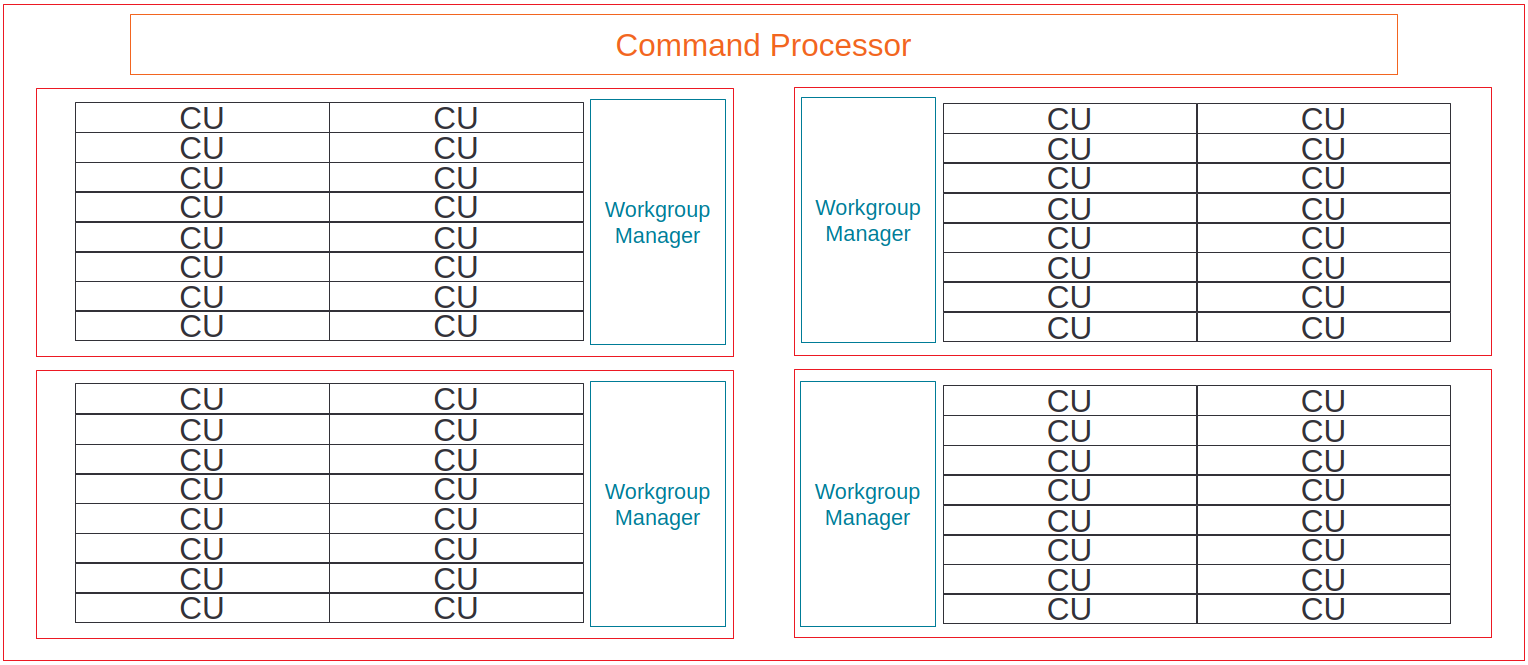
Example of CU-grouping into shader-engines on AMD Instinct™ MI accelerators.
The number of CUs on a SE varies from chip-to-chip (see, for example AMD GPU HIP Training, slide 20). In addition, newer accelerators such as the AMD Instinct™ MI 250X have 8 SEs per accelerator.
For the purposes of Omniperf, we consider resources that are shared between multiple CUs on a single SE as part of the SE’s metrics. These include:
Scalar L1 Data Cache (sL1D)
The Scalar L1 Data cache (sL1D) can cache data accessed from scalar load instructions (and scalar store instructions on architectures where they exist) from wavefronts in the CUs. The sL1D is shared between multiple CUs (GCN Crash Course, slide 36) — the exact number of CUs depends on the architecture in question (3 CUs in GCN GPUs and MI100, 2 CUs in MI2XX) — and is backed by the L2 cache.
In typical usage, the data in the sL1D is comprised of (e.g.,):
Kernel arguments, e.g., pointers, non-populated grid/block dimensions, etc.
HIP’s
__constant__memory, when accessed in a provably uniform1 mannerOther memory, when accessed in a provably uniform manner, and the backing memory is provably constant1
Note
1
The scalar data cache is used when the compiler emits scalar loads to access data.
This requires that the data be provably uniformly accessed (i.e., the compiler can verify that all work-items in a wavefront access the same data), and that the data can be proven to be read-only (e.g., HIP’s __constant__ memory, or properly __restrict__’ed pointers to avoid write-aliasing).
Access of e.g., __constant__ memory is not guaranteed to go through the sL1D if, e.g., the wavefront loads a non-uniform value.
Scalar L1D Speed-of-Light
Warning
The theoretical maximum throughput for some metrics in this section are currently computed with the maximum achievable clock frequency, as reported by rocminfo, for an accelerator. This may not be realistic for all workloads.
The Scalar L1D speed-of-light chart shows some key metrics of the sL1D cache as a comparison with the peak achievable values of those metrics:
Metric |
Description |
Unit |
|---|---|---|
Bandwidth |
The number of bytes looked up in the sL1D cache, as a percent of the peak theoretical bandwidth. Calculated as the ratio of sL1D requests over the total sL1D cycles. |
Percent |
Cache Hit Rate |
The percent of sL1D requests that hit1 on a previously loaded line in the cache. Calculated as the ratio of the number of sL1D requests that hit over the number of all sL1D requests. |
Percent |
sL1D-L2 BW |
The number of bytes requested by the sL1D from the L2 cache, as a percent of the peak theoretical sL1D → L2 cache bandwidth. Calculated as the ratio of the total number of requests from the sL1D to the L2 cache over the total sL1D-L2 interface cycles. |
Percent |
Note
1 Unlike the vL1D and L2 caches, the sL1D cache on AMD Instinct™ MI CDNA accelerators does not use “hit-on-miss” approach to reporting cache hits. That is, if while satisfying a miss, another request comes in that would hit on the same pending cache line, the subsequent request will be counted as a ‘duplicated miss’ (see below).
Scalar L1D Cache Accesses
This panel gives more detail on the types of accesses made to the sL1D, and the hit/miss statistics.
Metric |
Description |
Unit |
|---|---|---|
Requests |
The total number of requests, of any size or type, made to the sL1D per normalization-unit. |
Requests per normalization-unit |
Hits |
The total number of sL1D requests that hit on a previously loaded cache line, per normalization-unit. |
Requests per normalization-unit |
Misses - Non Duplicated |
The total number of sL1D requests that missed on a cache line that was not already pending due to another request, per normalization-unit. See note in speed-of-light section for more detail. |
Requests per normalization-unit |
Misses - Duplicated |
The total number of sL1D requests that missed on a cache line that was already pending due to another request, per normalization-unit. See note in speed-of-light section for more detail. |
Requests per normalization-unit |
Cache Hit Rate |
Indicates the percent of sL1D requests that hit on a previously loaded line the cache. The ratio of the number of sL1D requests that hit1 over the number of all sL1D requests. |
Percent |
Read Requests (Total) |
The total number of sL1D read requests of any size, per normalization-unit. |
Requests per normalization-unit |
Atomic Requests |
The total number of sL1D atomic requests of any size, per normalization-unit. Typically unused on CDNA accelerators. |
Requests per normalization-unit |
Read Requests (1 DWord) |
The total number of sL1D read requests made for a single dword of data (4B), per normalization-unit. |
Requests per normalization-unit |
Read Requests (2 DWord) |
The total number of sL1D read requests made for a two dwords of data (8B), per normalization-unit. |
Requests per normalization-unit |
Read Requests (4 DWord) |
The total number of sL1D read requests made for a four dwords of data (16B), per normalization-unit. |
Requests per normalization-unit |
Read Requests (8 DWord) |
The total number of sL1D read requests made for a eight dwords of data (32B), per normalization-unit. |
Requests per normalization-unit |
Read Requests (16 DWord) |
The total number of sL1D read requests made for a sixteen dwords of data (64B), per normalization-unit. |
Requests per normalization-unit |
Note
1Unlike the vL1D and L2 caches, the sL1D cache on AMD Instinct™ MI CDNA accelerators does not use “hit-on-miss” approach to reporting cache hits. That is, if while satisfying a miss, another request comes in that would hit on the same pending cache line, the subsequent request will be counted as a ‘duplicated miss’ (see below).
sL1D ↔ L2 Interface
This panel gives more detail on the data requested across the sL1D↔L2 interface.
Metric |
Description |
Unit |
|---|---|---|
sL1D-L2 BW |
The total number of bytes read from/written to/atomically updated across the sL1D↔L2 interface, per normalization-unit. Note that sL1D writes and atomics are typically unused on current CDNA accelerators, so in the majority of cases this can be interpreted as an sL1D→L2 read bandwidth. |
Bytes per normalization-unit |
Read Requests |
The total number of read requests from sL1D to the L2, per normalization-unit. |
Requests per normalization-unit |
Write Requests |
The total number of write requests from sL1D to the L2, per normalization-unit. Typically unused on current CDNA accelerators. |
Requests per normalization-unit |
Atomic Requests |
The total number of atomic requests from sL1D to the L2, per normalization-unit. Typically unused on current CDNA accelerators. |
Requests per normalization-unit |
Stall Cycles |
The total number of cycles the sL1D↔L2 interface was stalled, per normalization-unit. |
Cycles per normalization-unit |
L1 Instruction Cache (L1I)
As with the sL1D, the L1 Instruction (L1I) cache is shared between multiple CUs on a shader-engine, where the precise number of CUs sharing a L1I depends on the architecture in question (GCN Crash Course, slide 36) and is backed by the L2 cache. Unlike the sL1D, the instruction cache is read-only.
L1I Speed-of-Light
Warning
The theoretical maximum throughput for some metrics in this section are currently computed with the maximum achievable clock frequency, as reported by rocminfo, for an accelerator. This may not be realistic for all workloads.
The L1 Instruction Cache speed-of-light chart shows some key metrics of the L1I cache as a comparison with the peak achievable values of those metrics:
Metric |
Description |
Unit |
|---|---|---|
Bandwidth |
The number of bytes looked up in the L1I cache, as a percent of the peak theoretical bandwidth. Calculated as the ratio of L1I requests over the total L1I cycles. |
Percent |
Cache Hit Rate |
The percent of L1I requests that hit on a previously loaded line the cache. Calculated as the ratio of the number of L1I requests that hit1 over the number of all L1I requests. |
Percent |
L1I-L2 BW |
The percent of the peak theoretical L1I → L2 cache request bandwidth achieved. Calculated as the ratio of the total number of requests from the L1I to the L2 cache over the total L1I-L2 interface cycles. |
Percent |
Instruction Fetch Latency |
The average number of cycles spent to fetch instructions to a CU. |
Cycles |
Note
1Unlike the vL1D and L2 caches, the L1I cache on AMD Instinct™ MI CDNA accelerators does not use “hit-on-miss” approach to reporting cache hits. That is, if while satisfying a miss, another request comes in that would hit on the same pending cache line, the subsequent request will be counted as a ‘duplicated miss’ (see below).
L1I Cache Accesses
This panel gives more detail on the hit/miss statistics of the L1I:
Metric |
Description |
Unit |
|---|---|---|
Requests |
The total number of requests made to the L1I per normalization-unit. |
Requests per normalization-unit |
Hits |
The total number of L1I requests that hit on a previously loaded cache line, per normalization-unit. |
Requests per normalization-unit |
Misses - Non Duplicated |
The total number of L1I requests that missed on a cache line that was not already pending due to another request, per normalization-unit. See note in speed-of-light section for more detail. |
Requests per normalization-unit |
Misses - Duplicated |
The total number of L1I requests that missed on a cache line that was already pending due to another request, per normalization-unit. See note in speed-of-light section for more detail. |
Requests per normalization-unit |
Cache Hit Rate |
The percent of L1I requests that hit1 on a previously loaded line the cache. Calculated as the ratio of the number of L1I requests that hit over the the number of all L1I requests. |
Percent |
Note
1Unlike the vL1D and L2 caches, the L1I cache on AMD Instinct™ MI CDNA accelerators does not use “hit-on-miss” approach to reporting cache hits. That is, if while satisfying a miss, another request comes in that would hit on the same pending cache line, the subsequent request will be counted as a ‘duplicated miss’ (see below).
L1I - L2 Interface
This panel gives more detail on the data requested across the L1I-L2 interface.
Metric |
Description |
Unit |
|---|---|---|
L1I-L2 BW |
The total number of bytes read across the L1I-L2 interface, per normalization-unit. |
Bytes per normalization-unit |
Workgroup manager (SPI)
The workgroup manager (SPI) is the bridge between the command processor and the compute units. After the command processor processes a kernel dispatch, it will then pass the dispatch off to the workgroup manager, which then schedules workgroups onto the compute units. As workgroups complete execution and resources become available, the workgroup manager will schedule new workgroups onto compute units. The workgroup manager’s metrics therefore are focused on reporting, e.g.:
Utilizations of various parts of the accelerator that the workgroup manager interacts with (and the workgroup manager itself)
How many workgroups were dispatched, their size, and how many resources they used
Percent of scheduler opportunities (cycles) where workgroups failed to dispatch, and
Percent of scheduler opportunities (cycles) where workgroups failed to dispatch due to lack of a specific resource on the CUs (e.g., too many VGPRs allocated)
This gives the user an idea of why the workgroup manager couldn’t schedule more wavefronts onto the device, and is most useful for workloads that the user suspects to be scheduling/launch-rate limited.
As discussed in the command processor description, the command processor on AMD Instinct™ MI architectures contains four hardware scheduler-pipes, each with eight software threads (“Vega10” - Mantor, slide 19). Each scheduler-pipe can issue a kernel dispatch to the workgroup manager to schedule concurrently. Therefore, some workgroup manager metrics are presented relative to the utilization of these scheduler-pipes (e.g., whether all four are issuing concurrently).
Note
Current versions of the profiling libraries underlying Omniperf attempt to serialize concurrent kernels running on the accelerator, as the performance counters on the device are global (i.e., shared between concurrent kernels). This means that these scheduler-pipe utilization metrics are expected to reach e.g., a maximum of one pipe active, i.e., only 25%.
Workgroup Manager Utilizations
This section describes the utilization of the workgroup manager, and the hardware components it interacts with.
Metric |
Description |
Unit |
|---|---|---|
Accelerator Utilization |
The percent of cycles in the kernel where the accelerator was actively doing any work. |
Percent |
Scheduler-Pipe Utilization |
The percent of total scheduler-pipe cycles in the kernel where the scheduler-pipes were actively doing any work. Note: this value is expected to range between 0-25%, see note in workgroup-manager description. |
Percent |
Workgroup Manager Utilization |
The percent of cycles in the kernel where the Workgroup Manager was actively doing any work. |
Percent |
Shader Engine Utilization |
The percent of total shader-engine cycles in the kernel where any CU in a shader-engine was actively doing any work, normalized over all shader-engines. Low values (e.g., << 100%) indicate that the accelerator was not fully saturated by the kernel, or a potential load-imbalance issue. |
Percent |
SIMD Utilization |
The percent of total SIMD cycles in the kernel where any SIMD on a CU was actively doing any work, summed over all CUs. Low values (e.g., << 100%) indicate that the accelerator was not fully saturated by the kernel, or a potential load-imbalance issue. |
Percent |
Dispatched Workgroups |
The total number of workgroups forming this kernel launch. |
Workgroups |
Dispatched Wavefronts |
The total number of wavefronts, summed over all workgroups, forming this kernel launch. |
Wavefronts |
VGPR Writes |
The average number of cycles spent initializing VGPRs at wave creation. |
Cycles/wave |
SGPR Writes |
The average number of cycles spent initializing SGPRs at wave creation. |
Cycles/wave |
Workgroup Manager - Resource Allocation
This panel gives more detail on how workgroups/wavefronts were scheduled onto compute units, and what occupancy limiters they hit (if any). When analyzing these metrics, the user should also take into account their achieved occupancy (i.e., Wavefront occupancy). A kernel may be occupancy limited by e.g., LDS usage, but may still achieve high occupancy levels such that improving occupancy further may not improve performance. See the Workgroup Manager - Occupancy Limiters example for more details.
Metric |
Description |
Unit |
|---|---|---|
Not-scheduled Rate (Workgroup Manager) |
The percent of total scheduler-pipe cycles in the kernel where a workgroup could not be scheduled to a CU due to a bottleneck within the workgroup manager rather than a lack of a CU/SIMD with sufficient resources. Note: this value is expected to range between 0-25%, see note in workgroup-manager description. |
Percent |
Not-scheduled Rate (Scheduler-Pipe) |
The percent of total scheduler-pipe cycles in the kernel where a workgroup could not be scheduled to a CU due to a bottleneck within the scheduler-pipes rather than a lack of a CU/SIMD with sufficient resources. Note: this value is expected to range between 0-25%, see note in workgroup-manager description. |
Percent |
Scheduler-Pipe Stall Rate |
The percent of total scheduler-pipe cycles in the kernel where a workgroup could not be scheduled to a CU due to occupancy limitations (i.e., a lack of a CU/SIMD with sufficient resources). Note: this value is expected to range between 0-25%, see note in workgroup-manager description. |
Percent |
Scratch Stall Rate |
The percent of total shader-engine cycles in the kernel where a workgroup could not be scheduled to a CU due to lack of private (a.k.a., scratch) memory slots. While this can reach up to 100%, we note that the actual occupancy limitations on a kernel using private memory are typically quite small (e.g., <1% of the total number of waves that can be scheduled to an accelerator). |
Percent |
Insufficient SIMD Waveslots |
The percent of total SIMD cycles in the kernel where a workgroup could not be scheduled to a SIMD due to lack of available waveslots. |
Percent |
Insufficient SIMD VGPRs |
The percent of total SIMD cycles in the kernel where a workgroup could not be scheduled to a SIMD due to lack of available VGPRs. |
Percent |
Insufficient SIMD SGPRs |
The percent of total SIMD cycles in the kernel where a workgroup could not be scheduled to a SIMD due to lack of available SGPRs. |
Percent |
Insufficient CU LDS |
The percent of total CU cycles in the kernel where a workgroup could not be scheduled to a CU due to lack of available LDS. |
Percent |
Insufficient CU Barriers |
The percent of total CU cycles in the kernel where a workgroup could not be scheduled to a CU due to lack of available barriers. |
Percent |
Reached CU Workgroup Limit |
The percent of total CU cycles in the kernel where a workgroup could not be scheduled to a CU due to limits within the workgroup manager. This is expected to be always be zero on CDNA2 or newer accelerators (and small for previous accelerators). |
Percent |
Reached CU Wavefront Limit |
The percent of total CU cycles in the kernel where a wavefront could not be scheduled to a CU due to limits within the workgroup manager. This is expected to be always be zero on CDNA2 or newer accelerators (and small for previous accelerators). |
Percent |
Command Processor (CP)
The command processor – a.k.a., the CP – is responsible for interacting with the AMDGPU Kernel Driver (a.k.a., the Linux Kernel) on the CPU and for interacting with user-space HSA clients when they submit commands to HSA queues. Basic tasks of the CP include reading commands (e.g., corresponding to a kernel launch) out of HSA Queues (Sec. 2.5), scheduling work to subsequent parts of the scheduler pipeline, and marking kernels complete for synchronization events on the host.
The command processor is composed of two sub-components:
Fetcher (CPF): Fetches commands out of memory to hand them over to the CPC for processing
Packet Processor (CPC): The micro-controller running the command processing firmware that decodes the fetched commands, and (for kernels) passes them to the Workgroup Processors for scheduling
Before scheduling work to the accelerator, the command-processor can first acquire a memory fence to ensure system consistency (Sec 2.6.4). After the work is complete, the command-processor can apply a memory-release fence. Depending on the AMD CDNA accelerator under question, either of these operations may initiate a cache write-back or invalidation.
Analyzing command processor performance is most interesting for kernels that the user suspects to be scheduling/launch-rate limited. The command processor’s metrics therefore are focused on reporting, e.g.:
Utilization of the fetcher
Utilization of the packet processor, and decoding processing packets
Fetch/processing stalls
Command Processor Fetcher (CPF) Metrics
Metric |
Description |
Unit |
|---|---|---|
CPF Utilization |
Percent of total cycles where the CPF was busy actively doing any work. The ratio of CPF busy cycles over total cycles counted by the CPF. |
Percent |
CPF Stall |
Percent of CPF busy cycles where the CPF was stalled for any reason. |
Percent |
CPF-L2 Utilization |
Percent of total cycles counted by the CPF-L2 interface where the CPF-L2 interface was active doing any work. The ratio of CPF-L2 busy cycles over total cycles counted by the CPF-L2. |
Percent |
CPF-L2 Stall |
Percent of CPF-L2 busy cycles where the CPF-L2 interface was stalled for any reason. |
Percent |
CPF-UTCL1 Stall |
Percent of CPF busy cycles where the CPF was stalled by address translation. |
Percent |
Command Processor Packet Processor (CPC) Metrics
Metric |
Description |
Unit |
|---|---|---|
CPC Utilization |
Percent of total cycles where the CPC was busy actively doing any work. The ratio of CPC busy cycles over total cycles counted by the CPC. |
Percent |
CPC Stall |
Percent of CPC busy cycles where the CPC was stalled for any reason. |
Percent |
CPC Packet Decoding Utilization |
Percent of CPC busy cycles spent decoding commands for processing. |
Percent |
CPC-Workgroup Manager Utilization |
Percent of CPC busy cycles spent dispatching workgroups to the Workgroup Manager. |
Percent |
CPC-L2 Utilization |
Percent of total cycles counted by the CPC-L2 interface where the CPC-L2 interface was active doing any work. |
Percent |
CPC-UTCL1 Stall |
Percent of CPC busy cycles where the CPC was stalled by address translation. |
Percent |
CPC-UTCL2 Utilization |
Percent of total cycles counted by the CPC’s L2 address translation interface where the CPC was busy doing address translation work. |
Percent |
System Speed-of-Light
Warning
The theoretical maximum throughput for some metrics in this section are currently computed with the maximum achievable clock frequency, as reported by rocminfo, for an accelerator. This may not be realistic for all workloads.
In addition, not all metrics (e.g., FLOP counters) are available on all AMD Instinct™ MI accelerators. For more detail on how operations are counted, see the FLOP counting convention section.
Finally, the system speed-of-light summarizes some of the key metrics from various sections of Omniperf’s profiling report.
Metric |
Description |
Unit |
|---|---|---|
VALU FLOPs |
The total floating-point operations executed per second on the VALU. This is also presented as a percent of the peak theoretical FLOPs achievable on the specific accelerator. Note: this does not include any floating-point operations from MFMA instructions. |
GFLOPs |
VALU IOPs |
The total integer operations executed per second on the VALU. This is also presented as a percent of the peak theoretical IOPs achievable on the specific accelerator. Note: this does not include any integer operations from MFMA instructions. |
GIOPs |
MFMA FLOPs (BF16) |
The total number of 16-bit brain floating point MFMA operations executed per second. Note: this does not include any 16-bit brain floating point operations from VALU instructions. This is also presented as a percent of the peak theoretical BF16 MFMA operations achievable on the specific accelerator. |
GFLOPs |
MFMA FLOPs (F16) |
The total number of 16-bit floating point MFMA operations executed per second. Note: this does not include any 16-bit floating point operations from VALU instructions. This is also presented as a percent of the peak theoretical F16 MFMA operations achievable on the specific accelerator. |
GFLOPs |
MFMA FLOPs (F32) |
The total number of 32-bit floating point MFMA operations executed per second. Note: this does not include any 32-bit floating point operations from VALU instructions. This is also presented as a percent of the peak theoretical F32 MFMA operations achievable on the specific accelerator. |
GFLOPs |
MFMA FLOPs (F64) |
The total number of 64-bit floating point MFMA operations executed per second. Note: this does not include any 64-bit floating point operations from VALU instructions. This is also presented as a percent of the peak theoretical F64 MFMA operations achievable on the specific accelerator. |
GFLOPs |
MFMA IOPs (INT8) |
The total number of 8-bit integer MFMA operations executed per second. Note: this does not include any 8-bit integer operations from VALU instructions. This is also presented as a percent of the peak theoretical INT8 MFMA operations achievable on the specific accelerator. |
GIOPs |
SALU Utilization |
Indicates what percent of the kernel’s duration the SALU was busy executing instructions. Computed as the ratio of the total number of cycles spent by the scheduler issuing SALU / SMEM instructions over the total CU cycles. |
Percent |
VALU Utilization |
Indicates what percent of the kernel’s duration the VALU was busy executing instructions. Does not include VMEM operations. Computed as the ratio of the total number of cycles spent by the scheduler issuing VALU instructions over the total CU cycles. |
Percent |
MFMA Utilization |
Indicates what percent of the kernel’s duration the MFMA unit was busy executing instructions. Computed as the ratio of the total number of cycles the MFMA was busy over the total CU cycles. |
Percent |
VMEM Utilization |
Indicates what percent of the kernel’s duration the VMEM unit was busy executing instructions, including both global/generic and spill/scratch operations (see the VMEM instruction count metrics for more detail). Does not include VALU operations. Computed as the ratio of the total number of cycles spent by the scheduler issuing VMEM instructions over the total CU cycles. |
Percent |
Branch Utilization |
Indicates what percent of the kernel’s duration the Branch unit was busy executing instructions. Computed as the ratio of the total number of cycles spent by the scheduler issuing Branch instructions over the total CU cycles. |
Percent |
VALU Active Threads |
Indicates the average level of divergence within a wavefront over the lifetime of the kernel. The number of work-items that were active in a wavefront during execution of each VALU instruction, time-averaged over all VALU instructions run on all wavefronts in the kernel. |
Work-items |
IPC |
The ratio of the total number of instructions executed on the CU over the total active CU cycles. This is also presented as a percent of the peak theoretical bandwidth achievable on the specific accelerator. |
Instructions per-cycle |
Wavefront Occupancy |
The time-averaged number of wavefronts resident on the accelerator over the lifetime of the kernel. Note: this metric may be inaccurate for short-running kernels (<< 1ms). This is also presented as a percent of the peak theoretical occupancy achievable on the specific accelerator. |
Wavefronts |
LDS Theoretical Bandwidth |
Indicates the maximum amount of bytes that could have been loaded from/stored to/atomically updated in the LDS per unit time (see LDS Bandwidth example for more detail). This is also presented as a percent of the peak theoretical F64 MFMA operations achievable on the specific accelerator. |
GB/s |
LDS Bank Conflicts/Access |
The ratio of the number of cycles spent in the LDS scheduler due to bank conflicts (as determined by the conflict resolution hardware) to the base number of cycles that would be spent in the LDS scheduler in a completely uncontended case. This is also presented in normalized form (i.e., the Bank Conflict Rate). |
Conflicts/Access |
vL1D Cache Hit Rate |
The ratio of the number of vL1D cache line requests that hit in vL1D cache over the total number of cache line requests to the vL1D Cache RAM. |
Percent |
vL1D Cache Bandwidth |
The number of bytes looked up in the vL1D cache as a result of VMEM instructions per unit time. The number of bytes is calculated as the number of cache lines requested multiplied by the cache line size. This value does not consider partial requests, so e.g., if only a single value is requested in a cache line, the data movement will still be counted as a full cache line. This is also presented as a percent of the peak theoretical bandwidth achievable on the specific accelerator. |
GB/s |
L2 Cache Hit Rate |
The ratio of the number of L2 cache line requests that hit in the L2 cache over the total number of incoming cache line requests to the L2 cache. |
Percent |
L2 Cache Bandwidth |
The number of bytes looked up in the L2 cache per unit time. The number of bytes is calculated as the number of cache lines requested multiplied by the cache line size. This value does not consider partial requests, so e.g., if only a single value is requested in a cache line, the data movement will still be counted as a full cache line. This is also presented as a percent of the peak theoretical bandwidth achievable on the specific accelerator. |
GB/s |
L2-Fabric Read BW |
The number of bytes read by the L2 over the Infinity Fabric™ interface per unit time. This is also presented as a percent of the peak theoretical bandwidth achievable on the specific accelerator. |
GB/s |
L2-Fabric Write and Atomic BW |
The number of bytes sent by the L2 over the Infinity Fabric™ interface by write and atomic operations per unit time. This is also presented as a percent of the peak theoretical bandwidth achievable on the specific accelerator. |
GB/s |
L2-Fabric Read Latency |
The time-averaged number of cycles read requests spent in Infinity Fabric™ before data was returned to the L2. |
Cycles |
L2-Fabric Write Latency |
The time-averaged number of cycles write requests spent in Infinity Fabric™ before a completion acknowledgement was returned to the L2. |
Cycles |
sL1D Cache Hit Rate |
The percent of sL1D requests that hit on a previously loaded line the cache. Calculated as the ratio of the number of sL1D requests that hit over the number of all sL1D requests. |
Percent |
sL1D Bandwidth |
The number of bytes looked up in the sL1D cache per unit time. This is also presented as a percent of the peak theoretical bandwidth achievable on the specific accelerator. |
GB/s |
L1I Bandwidth |
The number of bytes looked up in the L1I cache per unit time. This is also presented as a percent of the peak theoretical bandwidth achievable on the specific accelerator. |
GB/s |
L1I Cache Hit Rate |
The percent of L1I requests that hit on a previously loaded line the cache. Calculated as the ratio of the number of L1I requests that hit over the number of all L1I requests. |
Percent |
L1I Fetch Latency |
The average number of cycles spent to fetch instructions to a CU. |
Cycles |
References
Disclaimer
PCIe® is a registered trademark of PCI-SIG Corporation.
Definitions
Miscellaneous
Name |
Description |
Unit |
|---|---|---|
Kernel Time |
The number of seconds the accelerator was executing a kernel, from the Command Processor’s start-of-kernel timestamp (which is a number of cycles after the CP begins processing the packet) to the CP’s end-of-kernel timestamp (which is a number of cycles before the CP stops processing the packet. |
Seconds |
Kernel Cycles |
The number of cycles the accelerator was active doing any work, as measured by the Command Processor. |
Cycles |
Total CU Cycles |
The number of cycles the accelerator was active doing any work (i.e., Kernel Cycles), multiplied by the number of compute units on the accelerator. A measure of the total possible active cycles the compute units could be doing work, useful for normalization of metrics inside the CU. |
Cycles |
Total Active CU Cycles |
The number of cycles a CU on the accelerator was active doing any work, summed over all compute units on the accelerator. |
Cycles |
Total SIMD Cycles |
The number of cycles the accelerator was active doing any work (i.e., Kernel Cycles), multiplied by the number of SIMDs on the accelerator. A measure of the total possible active cycles the SIMDs could be doing work, useful for normalization of metrics inside the CU. |
Cycles |
Total L2 Cycles |
The number of cycles the accelerator was active doing any work (i.e., Kernel Cycles), multiplied by the number of L2 channels on the accelerator. A measure of the total possible active cycles the L2 channels could be doing work, useful for normalization of metrics inside the L2. |
Cycles |
Total Active L2 Cycles |
The number of cycles a channel of the L2 cache was active doing any work, summed over all L2 channels on the accelerator. |
Cycles |
Total sL1D Cycles |
The number of cycles the accelerator was active doing any work (i.e., Kernel Cycles), multiplied by the number of scalar L1 Data caches on the accelerator. A measure of the total possible active cycles the sL1Ds could be doing work, useful for normalization of metrics inside the sL1D. |
Cycles |
Total L1I Cycles |
The number of cycles the accelerator was active doing any work (i.e., Kernel Cycles), multiplied by the number of L1 Instruction caches on the accelerator. A measure of the total possible active cycles the L1Is could be doing work, useful for normalization of metrics inside the L1I. |
Cycles |
Total Scheduler-Pipe Cycles |
The number of cycles the accelerator was active doing any work (i.e., Kernel Cycles), multiplied by the number of scheduler pipes on the accelerator. A measure of the total possible active cycles the scheduler-pipes could be doing work, useful for normalization of metrics inside the workgroup manager and command processor. |
Cycles |
Total Shader-Engine Cycles |
The total number of cycles the accelerator was active doing any work, multiplied by the number of Shader Engines on the accelerator. A measure of the total possible active cycles the Shader Engines could be doing work, useful for normalization of metrics inside the workgroup manager. |
Cycles |
Thread-requests |
The number of unique memory addresses accessed by a single memory instruction. On AMD’s Instinct™ accelerators, this a maximum of 64 (i.e., the size of the wavefront). |
Addresses |
Work-item |
A single ‘thread’ (lane) of execution, that executes in lockstep with the rest of the work-items comprising a wavefront of execution. |
N/A |
Wavefront |
A group of work-items, or threads, that execute in lockstep on the compute-unit. On AMD’s Instinct™ accelerators, the wavefront size is always 64 work-items. |
N/A |
Workgroup |
A group of wavefronts that execute on the same compute-unit, and can cooperatively execute and share data via the use of synchronization primitives, LDS, atomics, etc. |
N/A |
Divergence |
Divergence within a wavefront occurs when not all work-items are active when executing an instruction, e.g., due to non-uniform control flow within a wavefront. Can reduce overall execution efficiency by causing e.g., the VALU to have to execute both branches of a conditional with different sets of work-items active. |
N/A |
Normalization units
A user-configurable unit by which the user can choose to normalize data. Choices include:
Name |
Description |
|---|---|
|
The total value of the measured counter/metric that occurred per kernel invocation divided by the Kernel Cycles, i.e., total number of cycles the kernel executed as measured by the Command Processor. |
|
The total value of the measured counter/metric that occurred per kernel invocation divided by the total number of wavefronts launched in the kernel. |
|
The total value of the measured counter/metric that occurred per kernel invocation. |
|
The total value of the measured counter/metric that occurred per kernel invocation divided by the Kernel Time, i.e., the total runtime of the kernel in seconds, as measured by the Command Processor. |
By default, Omniperf uses the per_wave normalization. The appropriate normalization will vary depending on your use case.
For instance, a per_second normalization may be useful for FLOP or bandwidth comparisons, while a per_wave normalization may be useful (e.g.,) to see how many (and what types) of instructions are used per wavefront, and a per_kernel normalization may be useful to get the total aggregate values of metrics for comparison between different configurations.
Memory Spaces
AMD Instinct™ MI accelerators can access memory through multiple address spaces which may map to different physical memory locations on the system. The table below provides a view of how various types of memory used in HIP map onto these constructs:
LLVM Address Space |
Hardware Memory Space |
HIP Terminology |
|---|---|---|
Generic |
Flat |
N/A |
Global |
Global |
Global |
Local |
LDS |
LDS/Shared |
Private |
Scratch |
Private |
Constant |
Same as global |
Constant |
Below is a high-level description of the address spaces in the AMDGPU backend of LLVM:
Address space |
Description |
|---|---|
Global |
Memory that can be seen by all threads in a process, and may be backed by the local accelerator’s HBM, a remote accelerator’s HBM, or the CPU’s DRAM. |
Local |
Memory that is only visible to a particular workgroup. On AMD’s Instinct™ accelerator hardware, this is stored in LDS memory. |
Private |
Memory that is only visible to a particular work-item (thread), stored in the scratch space on AMD’s Instinct™ accelerators. |
Constant |
Read-only memory that is in the global address space and stored on the local accelerator’s HBM. |
Generic |
Used when the compiler cannot statically prove that a pointer is addressing memory in a single (non-generic) address space. Mapped to Flat on AMD’s Instinct™ accelerators, the pointer could dynamically address global, local, private or constant memory. |
LLVM’s documentation for AMDGPU Backend will always have the most up-to-date information, and the interested reader is referred to this source for a more complete explanation.
Memory Type
AMD Instinct™ accelerators contain a number of different memory allocation types to enable the HIP language’s memory coherency model. These memory types are broadly similar between AMD Instinct™ accelerator generations, but may differ in exact implementation.
In addition, these memory types may differ between accelerators on the same system, even when accessing the same memory allocation. For example, an MI2XX accelerator accessing “fine-grained” memory allocated local to that device may see the allocation as coherently cachable, while a remote accelerator might see the same allocation as uncached.
These memory types include:
Memory type |
Description |
|---|---|
Uncached Memory (UC) |
Memory that will not be cached in this accelerator. On MI2XX accelerators, this corresponds “fine-grained” (a.k.a., “coherent”) memory allocated on a remote accelerator or the host, e.g., using |
Non-hardware-Coherent Memory (NC) |
Memory that will be cached by the accelerator, and is only guaranteed to be consistent at kernel boundaries / after software-driven synchronization events. On MI2XX accelerators, this type of memory maps to (e.g.,) “coarse-grained” |
Coherently Cachable (CC) |
Memory for which only reads from the accelerator where the memory was allocated will be cached. Writes to CC memory are uncached, and trigger invalidations of any line within this accelerator. On MI2XX accelerators, this type of memory maps to “fine-grained” memory allocated on the local accelerator using, e.g., the |
Read/Write Coherent Memory (RW) |
Memory that will be cached by the accelerator, but may be invalidated by writes from remote devices at kernel boundaries / after software-driven synchronization events. On MI2XX accelerators, this corresponds to “coarse-grained” memory allocated locally to the accelerator, using e.g., the default |
A good discussion of coarse and fine grained memory allocations and what type of memory is returned by various combinations of memory allocators, flags and arguments can be found in the Crusher Quick-Start Guide.
Profiling with Omniperf by Example
VALU Arithmetic Instruction Mix
For this example, we consider the instruction mix sample distributed as a part of Omniperf.
Note
This example is expected to work on all CDNA accelerators, however the results in this section were collected on an MI2XX accelerator
Design note
This code uses a number of inline assembly instructions to cleanly identify the types of instructions being issued, as well as to avoid optimization / dead-code elimination by the compiler. While inline assembly is inherently unportable, this example is expected to work on all GCN GPUs and CDNA accelerators.
We reproduce a sample of the kernel below:
  // fp32: add, mul, transcendental and fma
  float f1, f2;
  asm volatile(
      "v_add_f32_e32 %0, %1, %0\n"
      "v_mul_f32_e32 %0, %1, %0\n"
      "v_sqrt_f32 %0, %1\n"
      "v_fma_f32 %0, %1, %0, %1\n"
      : "=v"(f1)
      : "v"(f2));
These instructions correspond to:
A 32-bit floating point addition,
A 32-bit floating point multiplication,
A 32-bit floating point square-root transcendental operation, and
A 32-bit floating point fused multiply-add operation.
For more detail, the reader is referred to (e.g.,) the CDNA2 ISA Guide.
Instruction mix
This example was compiled and run on a MI250 accelerator using ROCm v5.6.0, and Omniperf v2.0.0.
$ hipcc -O3 instmix.hip -o instmix
We generate our profile for this example via:
$ omniperf profile -n instmix --no-roof -- ./instmix
and finally, analyze the instruction mix section:
$ omniperf analyze -p workloads/instmix/mi200/ -b 10.2
<...>
10. Compute Units - Instruction Mix
10.2 VALU Arithmetic Instr Mix
╒═════════╤════════════╤═════════╤════════════════╕
│ Index   │ Metric     │   Count │ Unit           │
╞═════════╪════════════╪═════════╪════════════════╡
│ 10.2.0  │ INT32      │    1.00 │ Instr per wave │
├─────────┼────────────┼─────────┼────────────────┤
│ 10.2.1  │ INT64      │    1.00 │ Instr per wave │
├─────────┼────────────┼─────────┼────────────────┤
│ 10.2.2  │ F16-ADD    │    1.00 │ Instr per wave │
├─────────┼────────────┼─────────┼────────────────┤
│ 10.2.3  │ F16-MUL    │    1.00 │ Instr per wave │
├─────────┼────────────┼─────────┼────────────────┤
│ 10.2.4  │ F16-FMA    │    1.00 │ Instr per wave │
├─────────┼────────────┼─────────┼────────────────┤
│ 10.2.5  │ F16-Trans  │    1.00 │ Instr per wave │
├─────────┼────────────┼─────────┼────────────────┤
│ 10.2.6  │ F32-ADD    │    1.00 │ Instr per wave │
├─────────┼────────────┼─────────┼────────────────┤
│ 10.2.7  │ F32-MUL    │    1.00 │ Instr per wave │
├─────────┼────────────┼─────────┼────────────────┤
│ 10.2.8  │ F32-FMA    │    1.00 │ Instr per wave │
├─────────┼────────────┼─────────┼────────────────┤
│ 10.2.9  │ F32-Trans  │    1.00 │ Instr per wave │
├─────────┼────────────┼─────────┼────────────────┤
│ 10.2.10 │ F64-ADD    │    1.00 │ Instr per wave │
├─────────┼────────────┼─────────┼────────────────┤
│ 10.2.11 │ F64-MUL    │    1.00 │ Instr per wave │
├─────────┼────────────┼─────────┼────────────────┤
│ 10.2.12 │ F64-FMA    │    1.00 │ Instr per wave │
├─────────┼────────────┼─────────┼────────────────┤
│ 10.2.13 │ F64-Trans  │    1.00 │ Instr per wave │
├─────────┼────────────┼─────────┼────────────────┤
│ 10.2.14 │ Conversion │    1.00 │ Instr per wave │
╘═════════╧════════════╧═════════╧════════════════╛
shows that we have exactly one of each type of VALU arithmetic instruction, by construction!
Infinity-Fabric™ transactions
For this example, we consider the Infinity Fabric™ sample distributed as a part of Omniperf. This code launches a simple read-only kernel, e.g.:
// the main streaming kernel
__global__ void kernel(int* x, size_t N, int zero) {
  int sum = 0;
  const size_t offset_start = threadIdx.x + blockIdx.x * blockDim.x;
  for (int i = 0; i < 10; ++i) {
    for (size_t offset = offset_start; offset < N; offset += blockDim.x * gridDim.x) {
      sum += x[offset];
    }
  }
  if (sum != 0) {
    x[offset_start] = sum;
  }
}
twice; once as a warmup, and once for analysis.
We note that the buffer x is initialized to all zeros via a call to hipMemcpy on the host before the kernel is ever launched, therefore the conditional:
if (sum != 0) { ...
is identically false (and thus: we expect no writes).
Note
The actual sample included with Omniperf also includes the ability to select different operation types, e.g., atomics, writes, etc. This abbreviated version is presented here for reference only.
Finally, this sample code lets the user control:
The owner of an allocation (local HBM, CPU DRAM or remote HBM), and
The size of an allocation (the default is \(\sim4\)GiB)
via command line arguments. In doing so, we can explore the impact of these parameters on the L2-Fabric metrics reported by Omniperf to further understand their meaning.
All results in this section were generated an a node of Infinity Fabric™ connected MI250 accelerators using ROCm v5.6.0, and Omniperf v2.0.0. Although results may vary with ROCm versions and accelerator connectivity, we expect the lessons learned here to be broadly applicable.
Experiment #1 - Coarse-grained, accelerator-local HBM reads
In our first experiment, we consider the simplest possible case, a hipMalloc’d buffer that is local to our current accelerator:
$ omniperf profile -n coarse_grained_local --no-roof -- ./fabric -t 1 -o 0
Using:
  mtype:CoarseGrained
  mowner:Device
  mspace:Global
  mop:Read
  mdata:Unsigned
  remoteId:-1
<...>
$ omniperf analyze -p workloads/coarse_grained_local/mi200 -b 17.2.0 17.2.1 17.2.2 17.4.0 17.4.1 17.4.2 17.5.0 17.5.1 17.5.2 17.5.3 17.5.4 -n per_kernel --dispatch 2
<...>
17. L2 Cache
17.2 L2 - Fabric Transactions
╒═════════╤═════════════════════╤════════════════╤════════════════╤════════════════╤══════════════════╕
│ Index   │ Metric              │            Avg │            Min │            Max │ Unit             │
╞═════════╪═════════════════════╪════════════════╪════════════════╪════════════════╪══════════════════╡
│ 17.2.0  │ L2-Fabric Read BW   │ 42947428672.00 │ 42947428672.00 │ 42947428672.00 │ Bytes per kernel │
├─────────┼─────────────────────┼────────────────┼────────────────┼────────────────┼──────────────────┤
│ 17.2.1  │ HBM Read Traffic    │         100.00 │         100.00 │         100.00 │ Pct              │
├─────────┼─────────────────────┼────────────────┼────────────────┼────────────────┼──────────────────┤
│ 17.2.2  │ Remote Read Traffic │           0.00 │           0.00 │           0.00 │ Pct              │
╘═════════╧═════════════════════╧════════════════╧════════════════╧════════════════╧══════════════════╛
17.4 L2 - Fabric Interface Stalls
╒═════════╤═══════════════════════════════╤════════════════════════╤═══════════════╤═══════╤═══════╤═══════╤════════╕
│ Index   │ Metric                        │ Type                   │ Transaction   │   Avg │   Min │   Max │ Unit   │
╞═════════╪═══════════════════════════════╪════════════════════════╪═══════════════╪═══════╪═══════╪═══════╪════════╡
│ 17.4.0  │ Read - PCIe Stall             │ PCIe Stall             │ Read          │  0.00 │  0.00 │  0.00 │ Pct    │
├─────────┼───────────────────────────────┼────────────────────────┼───────────────┼───────┼───────┼───────┼────────┤
│ 17.4.1  │ Read - Infinity Fabric™ Stall │ Infinity Fabric™ Stall │ Read          │  0.00 │  0.00 │  0.00 │ Pct    │
├─────────┼───────────────────────────────┼────────────────────────┼───────────────┼───────┼───────┼───────┼────────┤
│ 17.4.2  │ Read - HBM Stall              │ HBM Stall              │ Read          │  0.07 │  0.07 │  0.07 │ Pct    │
╘═════════╧═══════════════════════════════╧════════════════════════╧═══════════════╧═══════╧═══════╧═══════╧════════╛
17.5 L2 - Fabric Detailed Transaction Breakdown
╒═════════╤═════════════════╤══════════════╤══════════════╤══════════════╤════════════════╕
│ Index   │ Metric          │          Avg │          Min │          Max │ Unit           │
╞═════════╪═════════════════╪══════════════╪══════════════╪══════════════╪════════════════╡
│ 17.5.0  │ Read (32B)      │         0.00 │         0.00 │         0.00 │ Req per kernel │
├─────────┼─────────────────┼──────────────┼──────────────┼──────────────┼────────────────┤
│ 17.5.1  │ Read (Uncached) │      1450.00 │      1450.00 │      1450.00 │ Req per kernel │
├─────────┼─────────────────┼──────────────┼──────────────┼──────────────┼────────────────┤
│ 17.5.2  │ Read (64B)      │ 671053573.00 │ 671053573.00 │ 671053573.00 │ Req per kernel │
├─────────┼─────────────────┼──────────────┼──────────────┼──────────────┼────────────────┤
│ 17.5.3  │ HBM Read        │ 671053565.00 │ 671053565.00 │ 671053565.00 │ Req per kernel │
├─────────┼─────────────────┼──────────────┼──────────────┼──────────────┼────────────────┤
│ 17.5.4  │ Remote Read     │         8.00 │         8.00 │         8.00 │ Req per kernel │
╘═════════╧═════════════════╧══════════════╧══════════════╧══════════════╧════════════════╛
Here, we see:
The vast majority of L2-Fabric requests (>99%) are 64B read requests (17.5.2)
Nearly 100% of the read requests (17.2.1) are homed in on the accelerator-local HBM (17.5.3), while some small fraction of these reads are routed to a “remote” device (17.5.4)
These drive a \(\sim40\)GiB per kernel read-bandwidth (17.2.0)
In addition, we see a small amount of uncached reads (17.5.1), these correspond to things like:
the assembly code to execute the kernel
kernel arguments
coordinate parameters (e.g., blockDim.z) that were not initialized by the hardware, etc. and may account for some of our ‘remote’ read requests (17.5.4), e.g., reading from CPU DRAM.
The above list is not exhaustive, nor are all of these guaranteed to be ‘uncached’ – the exact implementation depends on the accelerator and ROCm versions used. These read requests could be interrogated further in the Scalar L1 Data Cache and Instruction Cache metric sections.
Note
The Traffic metrics in Sec 17.2 are presented as a percentage of the total number of requests, e.g. ‘HBM Read Traffic’ is the percent of read requests (17.5.0-17.5.2) that were directed to the accelerators’ local HBM (17.5.3).
Experiment #2 - Fine-grained, accelerator-local HBM reads
In this experiment, we change the granularity of our device-allocation to be fine-grained device memory, local to the current accelerator.
Our code uses the hipExtMallocWithFlag API with the hipDeviceMallocFinegrained flag to accomplish this.
Note
On some systems (e.g., those with only PCIe® connected accelerators), you need to set the environment variable HSA_FORCE_FINE_GRAIN_PCIE=1 to enable this memory type.
$ omniperf profile -n fine_grained_local --no-roof -- ./fabric -t 0 -o 0
Using:
  mtype:FineGrained
  mowner:Device
  mspace:Global
  mop:Read
  mdata:Unsigned
  remoteId:-1
<...>
$ omniperf analyze -p workloads/fine_grained_local/mi200 -b 17.2.0 17.2.1 17.2.2 17.2.3 17.4.0 17.4.1 17.4.2 17.5.0 17.5.1 17.5.2 17.5.3 17.5.4  -n per_kernel --dispatch 2
<...>
17. L2 Cache
17.2 L2 - Fabric Transactions
╒═════════╤═══════════════════════╤════════════════╤════════════════╤════════════════╤══════════════════╕
│ Index   │ Metric                │            Avg │            Min │            Max │ Unit             │
╞═════════╪═══════════════════════╪════════════════╪════════════════╪════════════════╪══════════════════╡
│ 17.2.0  │ L2-Fabric Read BW     │ 42948661824.00 │ 42948661824.00 │ 42948661824.00 │ Bytes per kernel │
├─────────┼───────────────────────┼────────────────┼────────────────┼────────────────┼──────────────────┤
│ 17.2.1  │ HBM Read Traffic      │         100.00 │         100.00 │         100.00 │ Pct              │
├─────────┼───────────────────────┼────────────────┼────────────────┼────────────────┼──────────────────┤
│ 17.2.2  │ Remote Read Traffic   │           0.00 │           0.00 │           0.00 │ Pct              │
├─────────┼───────────────────────┼────────────────┼────────────────┼────────────────┼──────────────────┤
│ 17.2.3  │ Uncached Read Traffic │           0.00 │           0.00 │           0.00 │ Pct              │
╘═════════╧═══════════════════════╧════════════════╧════════════════╧════════════════╧══════════════════╛
17.4 L2 - Fabric Interface Stalls
╒═════════╤═══════════════════════════════╤════════════════════════╤═══════════════╤═══════╤═══════╤═══════╤════════╕
│ Index   │ Metric                        │ Type                   │ Transaction   │   Avg │   Min │   Max │ Unit   │
╞═════════╪═══════════════════════════════╪════════════════════════╪═══════════════╪═══════╪═══════╪═══════╪════════╡
│ 17.4.0  │ Read - PCIe Stall             │ PCIe Stall             │ Read          │  0.00 │  0.00 │  0.00 │ Pct    │
├─────────┼───────────────────────────────┼────────────────────────┼───────────────┼───────┼───────┼───────┼────────┤
│ 17.4.1  │ Read - Infinity Fabric™ Stall │ Infinity Fabric™ Stall │ Read          │  0.00 │  0.00 │  0.00 │ Pct    │
├─────────┼───────────────────────────────┼────────────────────────┼───────────────┼───────┼───────┼───────┼────────┤
│ 17.4.2  │ Read - HBM Stall              │ HBM Stall              │ Read          │  0.07 │  0.07 │  0.07 │ Pct    │
╘═════════╧═══════════════════════════════╧════════════════════════╧═══════════════╧═══════╧═══════╧═══════╧════════╛
17.5 L2 - Fabric Detailed Transaction Breakdown
╒═════════╤═════════════════╤══════════════╤══════════════╤══════════════╤════════════════╕
│ Index   │ Metric          │          Avg │          Min │          Max │ Unit           │
╞═════════╪═════════════════╪══════════════╪══════════════╪══════════════╪════════════════╡
│ 17.5.0  │ Read (32B)      │         0.00 │         0.00 │         0.00 │ Req per kernel │
├─────────┼─────────────────┼──────────────┼──────────────┼──────────────┼────────────────┤
│ 17.5.1  │ Read (Uncached) │      1334.00 │      1334.00 │      1334.00 │ Req per kernel │
├─────────┼─────────────────┼──────────────┼──────────────┼──────────────┼────────────────┤
│ 17.5.2  │ Read (64B)      │ 671072841.00 │ 671072841.00 │ 671072841.00 │ Req per kernel │
├─────────┼─────────────────┼──────────────┼──────────────┼──────────────┼────────────────┤
│ 17.5.3  │ HBM Read        │ 671072835.00 │ 671072835.00 │ 671072835.00 │ Req per kernel │
├─────────┼─────────────────┼──────────────┼──────────────┼──────────────┼────────────────┤
│ 17.5.4  │ Remote Read     │         6.00 │         6.00 │         6.00 │ Req per kernel │
╘═════════╧═════════════════╧══════════════╧══════════════╧══════════════╧════════════════╛
Comparing with our previous example, we see a relatively similar result, namely:
The vast majority of L2-Fabric requests are 64B read requests (17.5.2)
Nearly all these read requests are directed to the accelerator-local HBM (17.2.1)
In addition, we now see a small percentage of HBM Read Stalls (17.4.2), as streaming fine-grained memory is putting more stress on Infinity Fabric™.
Note
The stalls in Sec 17.4 are presented as a percentage of the total number active L2 cycles, summed over all L2 channels.
Experiment #3 - Fine-grained, remote-accelerator HBM reads
In this experiment, we move our fine-grained allocation to be owned by a remote accelerator.
We accomplish this by first changing the HIP device using e.g., hipSetDevice(1) API, then allocating fine-grained memory (as described previously), and finally resetting the device back to the default, e.g., hipSetDevice(0).
Although we have not changed our code significantly, we do see a substantial change in the L2-Fabric metrics:
$ omniperf profile -n fine_grained_remote --no-roof -- ./fabric -t 0 -o 2
Using:
  mtype:FineGrained
  mowner:Remote
  mspace:Global
  mop:Read
  mdata:Unsigned
  remoteId:-1
<...>
$ omniperf analyze -p workloads/fine_grained_remote/mi200 -b 17.2.0 17.2.1 17.2.2 17.2.3 17.4.0 17.4.1 17.4.2 17.5.0 17.5.1 17.5.2 17.5.3 17.5.4  -n per_kernel --dispatch 2
<...>
17. L2 Cache
17.2 L2 - Fabric Transactions
╒═════════╤═══════════════════════╤════════════════╤════════════════╤════════════════╤══════════════════╕
│ Index   │ Metric                │            Avg │            Min │            Max │ Unit             │
╞═════════╪═══════════════════════╪════════════════╪════════════════╪════════════════╪══════════════════╡
│ 17.2.0  │ L2-Fabric Read BW     │ 42949692736.00 │ 42949692736.00 │ 42949692736.00 │ Bytes per kernel │
├─────────┼───────────────────────┼────────────────┼────────────────┼────────────────┼──────────────────┤
│ 17.2.1  │ HBM Read Traffic      │           0.00 │           0.00 │           0.00 │ Pct              │
├─────────┼───────────────────────┼────────────────┼────────────────┼────────────────┼──────────────────┤
│ 17.2.2  │ Remote Read Traffic   │         100.00 │         100.00 │         100.00 │ Pct              │
├─────────┼───────────────────────┼────────────────┼────────────────┼────────────────┼──────────────────┤
│ 17.2.3  │ Uncached Read Traffic │         200.00 │         200.00 │         200.00 │ Pct              │
╘═════════╧═══════════════════════╧════════════════╧════════════════╧════════════════╧══════════════════╛
17.4 L2 - Fabric Interface Stalls
╒═════════╤═══════════════════════════════╤════════════════════════╤═══════════════╤═══════╤═══════╤═══════╤════════╕
│ Index   │ Metric                        │ Type                   │ Transaction   │   Avg │   Min │   Max │ Unit   │
╞═════════╪═══════════════════════════════╪════════════════════════╪═══════════════╪═══════╪═══════╪═══════╪════════╡
│ 17.4.0  │ Read - PCIe Stall             │ PCIe Stall             │ Read          │  0.00 │  0.00 │  0.00 │ Pct    │
├─────────┼───────────────────────────────┼────────────────────────┼───────────────┼───────┼───────┼───────┼────────┤
│ 17.4.1  │ Read - Infinity Fabric™ Stall │ Infinity Fabric™ Stall │ Read          │ 17.85 │ 17.85 │ 17.85 │ Pct    │
├─────────┼───────────────────────────────┼────────────────────────┼───────────────┼───────┼───────┼───────┼────────┤
│ 17.4.2  │ Read - HBM Stall              │ HBM Stall              │ Read          │  0.00 │  0.00 │  0.00 │ Pct    │
╘═════════╧═══════════════════════════════╧════════════════════════╧═══════════════╧═══════╧═══════╧═══════╧════════╛
17.5 L2 - Fabric Detailed Transaction Breakdown
╒═════════╤═════════════════╤═══════════════╤═══════════════╤═══════════════╤════════════════╕
│ Index   │ Metric          │           Avg │           Min │           Max │ Unit           │
╞═════════╪═════════════════╪═══════════════╪═══════════════╪═══════════════╪════════════════╡
│ 17.5.0  │ Read (32B)      │          0.00 │          0.00 │          0.00 │ Req per kernel │
├─────────┼─────────────────┼───────────────┼───────────────┼───────────────┼────────────────┤
│ 17.5.1  │ Read (Uncached) │ 1342177894.00 │ 1342177894.00 │ 1342177894.00 │ Req per kernel │
├─────────┼─────────────────┼───────────────┼───────────────┼───────────────┼────────────────┤
│ 17.5.2  │ Read (64B)      │  671088949.00 │  671088949.00 │  671088949.00 │ Req per kernel │
├─────────┼─────────────────┼───────────────┼───────────────┼───────────────┼────────────────┤
│ 17.5.3  │ HBM Read        │        307.00 │        307.00 │        307.00 │ Req per kernel │
├─────────┼─────────────────┼───────────────┼───────────────┼───────────────┼────────────────┤
│ 17.5.4  │ Remote Read     │  671088642.00 │  671088642.00 │  671088642.00 │ Req per kernel │
╘═════════╧═════════════════╧═══════════════╧═══════════════╧═══════════════╧════════════════╛
First, we see that while we still observe approximately the same number of 64B Read Requests (17.5.2), we now see an even larger number of Uncached Read Requests (17.5.3). Some simple division reveals:
That is, each 64B Read Request is also counted as two Uncached Read Requests, as reflected in the request-flow diagram. This is also why the Uncached Read Traffic metric (17.2.3) is at the counter-intuitive value of 200%!
In addition, we also observe that:
we no longer see any significant number of HBM Read Requests (17.2.1, 17.5.3), nor HBM Read Stalls (17.4.2), but instead
we observe that almost all of these requests are considered “remote” (17.2.2, 17.5.4) are being routed to another accelerator, or the CPU — in this case HIP Device 1 — and
we observe a significantly larger percentage of AMD Infinity Fabric™ Read Stalls (17.4.1) as compared to the HBM Read Stalls in the previous example
These stalls correspond to reads that are going out over the AMD Infinity Fabric™ connection to another MI250 accelerator. In addition, because these are crossing between accelerators, we expect significantly lower achievable bandwidths as compared to the local accelerator’s HBM – this is reflected (indirectly) in the magnitude of the stall metric (17.4.1). Finally, we note that if our system contained only PCIe® connected accelerators, these observations will differ.
Experiment #4 - Fine-grained, CPU-DRAM reads
In this experiment, we move our fine-grained allocation to be owned by the CPU’s DRAM.
We accomplish this by allocating host-pinned fine-grained memory using the hipHostMalloc API:
$ omniperf profile -n fine_grained_host --no-roof -- ./fabric -t 0 -o 1
Using:
  mtype:FineGrained
  mowner:Host
  mspace:Global
  mop:Read
  mdata:Unsigned
  remoteId:-1
<...>
$ omniperf analyze -p workloads/fine_grained_host/mi200 -b 17.2.0 17.2.1 17.2.2 17.2.3 17.4.0 17.4.1 17.4.2 17.5.0 17.5.1 17.5.2 17.5.3 17.5.4  -n per_kernel --dispatch 2
<...>
17. L2 Cache
17.2 L2 - Fabric Transactions
╒═════════╤═══════════════════════╤════════════════╤════════════════╤════════════════╤══════════════════╕
│ Index   │ Metric                │            Avg │            Min │            Max │ Unit             │
╞═════════╪═══════════════════════╪════════════════╪════════════════╪════════════════╪══════════════════╡
│ 17.2.0  │ L2-Fabric Read BW     │ 42949691264.00 │ 42949691264.00 │ 42949691264.00 │ Bytes per kernel │
├─────────┼───────────────────────┼────────────────┼────────────────┼────────────────┼──────────────────┤
│ 17.2.1  │ HBM Read Traffic      │           0.00 │           0.00 │           0.00 │ Pct              │
├─────────┼───────────────────────┼────────────────┼────────────────┼────────────────┼──────────────────┤
│ 17.2.2  │ Remote Read Traffic   │         100.00 │         100.00 │         100.00 │ Pct              │
├─────────┼───────────────────────┼────────────────┼────────────────┼────────────────┼──────────────────┤
│ 17.2.3  │ Uncached Read Traffic │         200.00 │         200.00 │         200.00 │ Pct              │
╘═════════╧═══════════════════════╧════════════════╧════════════════╧════════════════╧══════════════════╛
17.4 L2 - Fabric Interface Stalls
╒═════════╤═══════════════════════════════╤════════════════════════╤═══════════════╤═══════╤═══════╤═══════╤════════╕
│ Index   │ Metric                        │ Type                   │ Transaction   │   Avg │   Min │   Max │ Unit   │
╞═════════╪═══════════════════════════════╪════════════════════════╪═══════════════╪═══════╪═══════╪═══════╪════════╡
│ 17.4.0  │ Read - PCIe Stall             │ PCIe Stall             │ Read          │ 91.29 │ 91.29 │ 91.29 │ Pct    │
├─────────┼───────────────────────────────┼────────────────────────┼───────────────┼───────┼───────┼───────┼────────┤
│ 17.4.1  │ Read - Infinity Fabric™ Stall │ Infinity Fabric™ Stall │ Read          │  0.00 │  0.00 │  0.00 │ Pct    │
├─────────┼───────────────────────────────┼────────────────────────┼───────────────┼───────┼───────┼───────┼────────┤
│ 17.4.2  │ Read - HBM Stall              │ HBM Stall              │ Read          │  0.00 │  0.00 │  0.00 │ Pct    │
╘═════════╧═══════════════════════════════╧════════════════════════╧═══════════════╧═══════╧═══════╧═══════╧════════╛
17.5 L2 - Fabric Detailed Transaction Breakdown
╒═════════╤═════════════════╤═══════════════╤═══════════════╤═══════════════╤════════════════╕
│ Index   │ Metric          │           Avg │           Min │           Max │ Unit           │
╞═════════╪═════════════════╪═══════════════╪═══════════════╪═══════════════╪════════════════╡
│ 17.5.0  │ Read (32B)      │          0.00 │          0.00 │          0.00 │ Req per kernel │
├─────────┼─────────────────┼───────────────┼───────────────┼───────────────┼────────────────┤
│ 17.5.1  │ Read (Uncached) │ 1342177848.00 │ 1342177848.00 │ 1342177848.00 │ Req per kernel │
├─────────┼─────────────────┼───────────────┼───────────────┼───────────────┼────────────────┤
│ 17.5.2  │ Read (64B)      │  671088926.00 │  671088926.00 │  671088926.00 │ Req per kernel │
├─────────┼─────────────────┼───────────────┼───────────────┼───────────────┼────────────────┤
│ 17.5.3  │ HBM Read        │        284.00 │        284.00 │        284.00 │ Req per kernel │
├─────────┼─────────────────┼───────────────┼───────────────┼───────────────┼────────────────┤
│ 17.5.4  │ Remote Read     │  671088642.00 │  671088642.00 │  671088642.00 │ Req per kernel │
╘═════════╧═════════════════╧═══════════════╧═══════════════╧═══════════════╧════════════════╛
Here we see almost the same results as in the previous experiment, however now as we are crossing a PCIe® bus to the CPU, we see that the Infinity Fabric™ Read stalls (17.4.1) have shifted to be a PCIe® stall (17.4.2). In addition, as (on this system) the PCIe® bus has a lower peak bandwidth than the AMD Infinity Fabric™ connection between two accelerators, we once again observe an increase in the percentage of stalls on this interface.
Note
Had we performed this same experiment on a MI250X system, these transactions would again have been marked as Infinity Fabric™ Read stalls (17.4.1), as the CPU is connected to the accelerator via AMD Infinity Fabric.
Experiment #5 - Coarse-grained, CPU-DRAM reads
In our next fabric experiment, we change our CPU memory allocation to be coarse-grained.
We accomplish this by passing the hipHostMalloc API the hipHostMallocNonCoherent flag, to mark the allocation as coarse-grained:
$ omniperf profile -n coarse_grained_host --no-roof -- ./fabric -t 1 -o 1
Using:
  mtype:CoarseGrained
  mowner:Host
  mspace:Global
  mop:Read
  mdata:Unsigned
  remoteId:-1
<...>
$ omniperf analyze -p workloads/coarse_grained_host/mi200 -b 17.2.0 17.2.1 17.2.2 17.2.3 17.4.0 17.4.1 17.4.2 17.5.0 17.5.1 17.5.2 17.5.3 17.5.4  -n per_kernel --dispatch 2
<...>
17. L2 Cache
17.2 L2 - Fabric Transactions
╒═════════╤═══════════════════════╤════════════════╤════════════════╤════════════════╤══════════════════╕
│ Index   │ Metric                │            Avg │            Min │            Max │ Unit             │
╞═════════╪═══════════════════════╪════════════════╪════════════════╪════════════════╪══════════════════╡
│ 17.2.0  │ L2-Fabric Read BW     │ 42949691264.00 │ 42949691264.00 │ 42949691264.00 │ Bytes per kernel │
├─────────┼───────────────────────┼────────────────┼────────────────┼────────────────┼──────────────────┤
│ 17.2.1  │ HBM Read Traffic      │           0.00 │           0.00 │           0.00 │ Pct              │
├─────────┼───────────────────────┼────────────────┼────────────────┼────────────────┼──────────────────┤
│ 17.2.2  │ Remote Read Traffic   │         100.00 │         100.00 │         100.00 │ Pct              │
├─────────┼───────────────────────┼────────────────┼────────────────┼────────────────┼──────────────────┤
│ 17.2.3  │ Uncached Read Traffic │           0.00 │           0.00 │           0.00 │ Pct              │
╘═════════╧═══════════════════════╧════════════════╧════════════════╧════════════════╧══════════════════╛
17.4 L2 - Fabric Interface Stalls
╒═════════╤═══════════════════════════════╤════════════════════════╤═══════════════╤═══════╤═══════╤═══════╤════════╕
│ Index   │ Metric                        │ Type                   │ Transaction   │   Avg │   Min │   Max │ Unit   │
╞═════════╪═══════════════════════════════╪════════════════════════╪═══════════════╪═══════╪═══════╪═══════╪════════╡
│ 17.4.0  │ Read - PCIe Stall             │ PCIe Stall             │ Read          │ 91.27 │ 91.27 │ 91.27 │ Pct    │
├─────────┼───────────────────────────────┼────────────────────────┼───────────────┼───────┼───────┼───────┼────────┤
│ 17.4.1  │ Read - Infinity Fabric™ Stall │ Infinity Fabric™ Stall │ Read          │  0.00 │  0.00 │  0.00 │ Pct    │
├─────────┼───────────────────────────────┼────────────────────────┼───────────────┼───────┼───────┼───────┼────────┤
│ 17.4.2  │ Read - HBM Stall              │ HBM Stall              │ Read          │  0.00 │  0.00 │  0.00 │ Pct    │
╘═════════╧═══════════════════════════════╧════════════════════════╧═══════════════╧═══════╧═══════╧═══════╧════════╛
17.5 L2 - Fabric Detailed Transaction Breakdown
╒═════════╤═════════════════╤══════════════╤══════════════╤══════════════╤════════════════╕
│ Index   │ Metric          │          Avg │          Min │          Max │ Unit           │
╞═════════╪═════════════════╪══════════════╪══════════════╪══════════════╪════════════════╡
│ 17.5.0  │ Read (32B)      │         0.00 │         0.00 │         0.00 │ Req per kernel │
├─────────┼─────────────────┼──────────────┼──────────────┼──────────────┼────────────────┤
│ 17.5.1  │ Read (Uncached) │       562.00 │       562.00 │       562.00 │ Req per kernel │
├─────────┼─────────────────┼──────────────┼──────────────┼──────────────┼────────────────┤
│ 17.5.2  │ Read (64B)      │ 671088926.00 │ 671088926.00 │ 671088926.00 │ Req per kernel │
├─────────┼─────────────────┼──────────────┼──────────────┼──────────────┼────────────────┤
│ 17.5.3  │ HBM Read        │       281.00 │       281.00 │       281.00 │ Req per kernel │
├─────────┼─────────────────┼──────────────┼──────────────┼──────────────┼────────────────┤
│ 17.5.4  │ Remote Read     │ 671088645.00 │ 671088645.00 │ 671088645.00 │ Req per kernel │
╘═════════╧═════════════════╧══════════════╧══════════════╧══════════════╧════════════════╛
Here we see a similar result to our previous experiment, with one key difference: our accesses are no longer marked as Uncached Read requests (17.2.3, 17.5.1), but instead are 64B read requests (17.5.2), as observed in our Coarse-grained, accelerator-local HBM experiment.
Experiment #6 - Fine-grained, CPU-DRAM writes
Thus far in our exploration of the L2-Fabric interface, we have primarily focused on read operations. However, in our request flow diagram, we note that writes are counted separately. To obeserve this, we use the ‘-p’ flag to trigger write operations to fine-grained memory allocated on the host:
$ omniperf profile -n fine_grained_host_write --no-roof -- ./fabric -t 0 -o 1 -p 1
Using:
  mtype:FineGrained
  mowner:Host
  mspace:Global
  mop:Write
  mdata:Unsigned
  remoteId:-1
<...>
$ omniperf analyze -p workloads/fine_grained_host_writes/mi200 -b 17.2.4 17.2.5 17.2.6 17.2.7 17.2.8 17.4.3 17.4.4 17.4.5 17.4.6 17.5.5 17.5.6 17.5.7 17.5.8 17.5.9 17.5.10 -n per_kernel --dispatch 2
<...>
17. L2 Cache
17.2 L2 - Fabric Transactions
╒═════════╤═══════════════════════════════════╤════════════════╤════════════════╤════════════════╤══════════════════╕
│ Index   │ Metric                            │            Avg │            Min │            Max │ Unit             │
╞═════════╪═══════════════════════════════════╪════════════════╪════════════════╪════════════════╪══════════════════╡
│ 17.2.4  │ L2-Fabric Write and Atomic BW     │ 42949672960.00 │ 42949672960.00 │ 42949672960.00 │ Bytes per kernel │
├─────────┼───────────────────────────────────┼────────────────┼────────────────┼────────────────┼──────────────────┤
│ 17.2.5  │ HBM Write and Atomic Traffic      │           0.00 │           0.00 │           0.00 │ Pct              │
├─────────┼───────────────────────────────────┼────────────────┼────────────────┼────────────────┼──────────────────┤
│ 17.2.6  │ Remote Write and Atomic Traffic   │         100.00 │         100.00 │         100.00 │ Pct              │
├─────────┼───────────────────────────────────┼────────────────┼────────────────┼────────────────┼──────────────────┤
│ 17.2.7  │ Atomic Traffic                    │           0.00 │           0.00 │           0.00 │ Pct              │
├─────────┼───────────────────────────────────┼────────────────┼────────────────┼────────────────┼──────────────────┤
│ 17.2.8  │ Uncached Write and Atomic Traffic │         100.00 │         100.00 │         100.00 │ Pct              │
╘═════════╧═══════════════════════════════════╧════════════════╧════════════════╧════════════════╧══════════════════╛
17.4 L2 - Fabric Interface Stalls
╒═════════╤════════════════════════════════╤════════════════════════╤═══════════════╤═══════╤═══════╤═══════╤════════╕
│ Index   │ Metric                         │ Type                   │ Transaction   │   Avg │   Min │   Max │ Unit   │
╞═════════╪════════════════════════════════╪════════════════════════╪═══════════════╪═══════╪═══════╪═══════╪════════╡
│ 17.4.3  │ Write - PCIe Stall             │ PCIe Stall             │ Write         │  0.00 │  0.00 │  0.00 │ Pct    │
├─────────┼────────────────────────────────┼────────────────────────┼───────────────┼───────┼───────┼───────┼────────┤
│ 17.4.4  │ Write - Infinity Fabric™ Stall │ Infinity Fabric™ Stall │ Write         │  0.00 │  0.00 │  0.00 │ Pct    │
├─────────┼────────────────────────────────┼────────────────────────┼───────────────┼───────┼───────┼───────┼────────┤
│ 17.4.5  │ Write - HBM Stall              │ HBM Stall              │ Write         │  0.00 │  0.00 │  0.00 │ Pct    │
├─────────┼────────────────────────────────┼────────────────────────┼───────────────┼───────┼───────┼───────┼────────┤
│ 17.4.6  │ Write - Credit Starvation      │ Credit Starvation      │ Write         │  0.00 │  0.00 │  0.00 │ Pct    │
╘═════════╧════════════════════════════════╧════════════════════════╧═══════════════╧═══════╧═══════╧═══════╧════════╛
17.5 L2 - Fabric Detailed Transaction Breakdown
╒═════════╤═════════════════════════╤══════════════╤══════════════╤══════════════╤════════════════╕
│ Index   │ Metric                  │          Avg │          Min │          Max │ Unit           │
╞═════════╪═════════════════════════╪══════════════╪══════════════╪══════════════╪════════════════╡
│ 17.5.5  │ Write (32B)             │         0.00 │         0.00 │         0.00 │ Req per kernel │
├─────────┼─────────────────────────┼──────────────┼──────────────┼──────────────┼────────────────┤
│ 17.5.6  │ Write (Uncached)        │ 671088640.00 │ 671088640.00 │ 671088640.00 │ Req per kernel │
├─────────┼─────────────────────────┼──────────────┼──────────────┼──────────────┼────────────────┤
│ 17.5.7  │ Write (64B)             │ 671088640.00 │ 671088640.00 │ 671088640.00 │ Req per kernel │
├─────────┼─────────────────────────┼──────────────┼──────────────┼──────────────┼────────────────┤
│ 17.5.8  │ HBM Write and Atomic    │         0.00 │         0.00 │         0.00 │ Req per kernel │
├─────────┼─────────────────────────┼──────────────┼──────────────┼──────────────┼────────────────┤
│ 17.5.9  │ Remote Write and Atomic │ 671088640.00 │ 671088640.00 │ 671088640.00 │ Req per kernel │
├─────────┼─────────────────────────┼──────────────┼──────────────┼──────────────┼────────────────┤
│ 17.5.10 │ Atomic                  │         0.00 │         0.00 │         0.00 │ Req per kernel │
╘═════════╧═════════════════════════╧══════════════╧══════════════╧══════════════╧════════════════╛
Here we notice a few changes in our request pattern:
As expected, the requests have changed from 64B Reads to 64B Write requests (17.5.7),
these requests are homed in on a “remote” destination (17.2.6, 17.5.9), as expected, and,
these are also counted as a single Uncached Write request (17.5.6).
In addition, there rather significant changes in the bandwidth values reported:
the “L2-Fabric Write and Atomic” bandwidth metric (17.2.4) reports about 40GiB of data written across Infinity Fabric™ while,
the “Remote Write and Traffic” metric (17.2.5) indicates that nearly 100% of these request are being directed to a remote source
The precise meaning of these metrics will be explored in the subsequent experiment.
Finally, we note that we see no write stalls on the PCIe® bus (17.4.3). This is because writes over a PCIe® bus are non-posted, i.e., they do not require acknowledgement.
Experiment #7 - Fine-grained, CPU-DRAM atomicAdd
Next, we change our experiment to instead target atomicAdd operations to the CPU’s DRAM.
$ omniperf profile -n fine_grained_host_add --no-roof -- ./fabric -t 0 -o 1 -p 2
Using:
  mtype:FineGrained
  mowner:Host
  mspace:Global
  mop:Add
  mdata:Unsigned
  remoteId:-1
<...>
$ omniperf analyze -p workloads/fine_grained_host_add/mi200 -b 17.2.4 17.2.5 17.2.6 17.2.7 17.2.8 17.4.3 17.4.4 17.4.5 17.4.6 17.5.5 17.5.6 17.5.7 17.5.8 17.5.9 17.5.10 -n per_kernel --dispatch 2
<...>
17. L2 Cache
17.2 L2 - Fabric Transactions
╒═════════╤═══════════════════════════════════╤══════════════╤══════════════╤══════════════╤══════════════════╕
│ Index   │ Metric                            │          Avg │          Min │          Max │ Unit             │
╞═════════╪═══════════════════════════════════╪══════════════╪══════════════╪══════════════╪══════════════════╡
│ 17.2.4  │ L2-Fabric Write and Atomic BW     │ 429496736.00 │ 429496736.00 │ 429496736.00 │ Bytes per kernel │
├─────────┼───────────────────────────────────┼──────────────┼──────────────┼──────────────┼──────────────────┤
│ 17.2.5  │ HBM Write and Atomic Traffic      │         0.00 │         0.00 │         0.00 │ Pct              │
├─────────┼───────────────────────────────────┼──────────────┼──────────────┼──────────────┼──────────────────┤
│ 17.2.6  │ Remote Write and Atomic Traffic   │       100.00 │       100.00 │       100.00 │ Pct              │
├─────────┼───────────────────────────────────┼──────────────┼──────────────┼──────────────┼──────────────────┤
│ 17.2.7  │ Atomic Traffic                    │       100.00 │       100.00 │       100.00 │ Pct              │
├─────────┼───────────────────────────────────┼──────────────┼──────────────┼──────────────┼──────────────────┤
│ 17.2.8  │ Uncached Write and Atomic Traffic │       100.00 │       100.00 │       100.00 │ Pct              │
╘═════════╧═══════════════════════════════════╧══════════════╧══════════════╧══════════════╧══════════════════╛
17.4 L2 - Fabric Interface Stalls
╒═════════╤════════════════════════════════╤════════════════════════╤═══════════════╤═══════╤═══════╤═══════╤════════╕
│ Index   │ Metric                         │ Type                   │ Transaction   │   Avg │   Min │   Max │ Unit   │
╞═════════╪════════════════════════════════╪════════════════════════╪═══════════════╪═══════╪═══════╪═══════╪════════╡
│ 17.4.3  │ Write - PCIe Stall             │ PCIe Stall             │ Write         │  0.00 │  0.00 │  0.00 │ Pct    │
├─────────┼────────────────────────────────┼────────────────────────┼───────────────┼───────┼───────┼───────┼────────┤
│ 17.4.4  │ Write - Infinity Fabric™ Stall │ Infinity Fabric™ Stall │ Write         │  0.00 │  0.00 │  0.00 │ Pct    │
├─────────┼────────────────────────────────┼────────────────────────┼───────────────┼───────┼───────┼───────┼────────┤
│ 17.4.5  │ Write - HBM Stall              │ HBM Stall              │ Write         │  0.00 │  0.00 │  0.00 │ Pct    │
├─────────┼────────────────────────────────┼────────────────────────┼───────────────┼───────┼───────┼───────┼────────┤
│ 17.4.6  │ Write - Credit Starvation      │ Credit Starvation      │ Write         │  0.00 │  0.00 │  0.00 │ Pct    │
╘═════════╧════════════════════════════════╧════════════════════════╧═══════════════╧═══════╧═══════╧═══════╧════════╛
17.5 L2 - Fabric Detailed Transaction Breakdown
╒═════════╤═════════════════════════╤═════════════╤═════════════╤═════════════╤════════════════╕
│ Index   │ Metric                  │         Avg │         Min │         Max │ Unit           │
╞═════════╪═════════════════════════╪═════════════╪═════════════╪═════════════╪════════════════╡
│ 17.5.5  │ Write (32B)             │ 13421773.00 │ 13421773.00 │ 13421773.00 │ Req per kernel │
├─────────┼─────────────────────────┼─────────────┼─────────────┼─────────────┼────────────────┤
│ 17.5.6  │ Write (Uncached)        │ 13421773.00 │ 13421773.00 │ 13421773.00 │ Req per kernel │
├─────────┼─────────────────────────┼─────────────┼─────────────┼─────────────┼────────────────┤
│ 17.5.7  │ Write (64B)             │        0.00 │        0.00 │        0.00 │ Req per kernel │
├─────────┼─────────────────────────┼─────────────┼─────────────┼─────────────┼────────────────┤
│ 17.5.8  │ HBM Write and Atomic    │        0.00 │        0.00 │        0.00 │ Req per kernel │
├─────────┼─────────────────────────┼─────────────┼─────────────┼─────────────┼────────────────┤
│ 17.5.9  │ Remote Write and Atomic │ 13421773.00 │ 13421773.00 │ 13421773.00 │ Req per kernel │
├─────────┼─────────────────────────┼─────────────┼─────────────┼─────────────┼────────────────┤
│ 17.5.10 │ Atomic                  │ 13421773.00 │ 13421773.00 │ 13421773.00 │ Req per kernel │
╘═════════╧═════════════════════════╧═════════════╧═════════════╧═════════════╧════════════════╛
In this case, there is quite a lot to unpack:
For the first time, the 32B Write requests (17.5.5) are heavily used.
These correspond to Atomic requests (17.2.7, 17.5.10), and are counted as Uncached Writes (17.5.6).
The L2-Fabric Write and Atomic bandwidth metric (17.2.4) shows about 0.4 GiB of traffic. For convenience, the sample reduces the default problem size for this case due to the speed of atomics across a PCIe® bus, and finally,
The traffic is directed to a remote device (17.2.6, 17.5.9)
Let us consider what an “atomic” request means in this context. Recall that we are discussing memory traffic flowing from the L2 cache, the device-wide coherence point on current CDNA accelerators such as the MI250, to e.g., the CPU’s DRAM. In this light, we see that these requests correspond to system scope atomics, and specifically in the case of the MI250, to fine-grained memory!
Vector memory operation counting
Global / Generic (FLAT)
For this example, we consider the vector-memory sample distributed as a part of Omniperf.
This code launches many different versions of a simple read/write/atomic-only kernels targeting various address spaces, e.g. below is our simple global_write kernel:
// write to a global pointer
__global__ void global_write(int* ptr, int zero) {
  ptr[threadIdx.x] = zero;
}
This example was compiled and run on an MI250 accelerator using ROCm v5.6.0, and Omniperf v2.0.0.
$ hipcc -O3 --save-temps vmem.hip -o vmem
We have also chosen to include the --save-temps flag to save the compiler temporary files, such as the generated CDNA assembly code, for inspection.
Finally, we generate our omniperf profile as:
$ omniperf profile -n vmem --no-roof -- ./vmem
Design note
We should explain some of the more peculiar line(s) of code in our example, e.g., the use of compiler builtins and explicit address space casting, etc.
// write to a generic pointer
typedef int __attribute__((address_space(0)))* generic_ptr;

__attribute__((noinline)) __device__ void generic_store(generic_ptr ptr, int zero) { *ptr = zero; }

__global__ void generic_write(int* ptr, int zero, int filter) {
  __shared__ int lds[1024];
  int* generic = (threadIdx.x < filter) ? &ptr[threadIdx.x] : &lds[threadIdx.x];
  generic_store((generic_ptr)generic, zero);
}
One of our aims in this example is to demonstrate the use of the ‘generic’ (a.k.a., FLAT) address space. This address space is typically used when the compiler cannot statically prove where the backing memory is located.
To try to force the compiler to use this address space, we have applied __attribute__((noinline)) to the generic_store function to have the compiler treat it as a function call (i.e., on the other-side of which, the address space may not be known).
However, in a trivial example such as this, the compiler may choose to specialize the generic_store function to the two address spaces that may provably be used from our translation-unit, i.e., ‘local’ (a.k.a., LDS) and ‘global’. Hence, we forcibly cast the address space to ‘generic’ (i.e., FLAT) to avoid this compiler optimization.
Warning
While convenient for our example here, this sort of explicit address space casting can lead to strange compilation errors, and in the worst cases, incorrect results and thus use is discouraged in production code.
For more details on address spaces, the reader is referred to the address-space section.
Global Write
First, we demonstrate our simple global_write kernel:
$ omniperf analyze -p workloads/vmem/mi200/ --dispatch 1 -b 10.3 15.1.4 15.1.5 15.1.6 15.1.7 15.1.8 15.1.9 15.1.10 15.1.11  -n per_kernel
<...>
--------------------------------------------------------------------------------
0. Top Stat
╒════╤═════════════════════════════════════╤═════════╤═══════════╤════════════╤══════════════╤════════╕
│    │ KernelName                          │   Count │   Sum(ns) │   Mean(ns) │   Median(ns) │    Pct │
╞════╪═════════════════════════════════════╪═════════╪═══════════╪════════════╪══════════════╪════════╡
│  0 │ global_write(int*, int) [clone .kd] │    1.00 │   2400.00 │    2400.00 │      2400.00 │ 100.00 │
╘════╧═════════════════════════════════════╧═════════╧═══════════╧════════════╧══════════════╧════════╛


--------------------------------------------------------------------------------
10. Compute Units - Instruction Mix
10.3 VMEM Instr Mix
╒═════════╤═══════════════════════╤═══════╤═══════╤═══════╤══════════════════╕
│ Index   │ Metric                │   Avg │   Min │   Max │ Unit             │
╞═════════╪═══════════════════════╪═══════╪═══════╪═══════╪══════════════════╡
│ 10.3.0  │ Global/Generic Instr  │  1.00 │  1.00 │  1.00 │ Instr per kernel │
├─────────┼───────────────────────┼───────┼───────┼───────┼──────────────────┤
│ 10.3.1  │ Global/Generic Read   │  0.00 │  0.00 │  0.00 │ Instr per kernel │
├─────────┼───────────────────────┼───────┼───────┼───────┼──────────────────┤
│ 10.3.2  │ Global/Generic Write  │  1.00 │  1.00 │  1.00 │ Instr per kernel │
├─────────┼───────────────────────┼───────┼───────┼───────┼──────────────────┤
│ 10.3.3  │ Global/Generic Atomic │  0.00 │  0.00 │  0.00 │ Instr per kernel │
├─────────┼───────────────────────┼───────┼───────┼───────┼──────────────────┤
│ 10.3.4  │ Spill/Stack Instr     │  0.00 │  0.00 │  0.00 │ Instr per kernel │
├─────────┼───────────────────────┼───────┼───────┼───────┼──────────────────┤
│ 10.3.5  │ Spill/Stack Read      │  0.00 │  0.00 │  0.00 │ Instr per kernel │
├─────────┼───────────────────────┼───────┼───────┼───────┼──────────────────┤
│ 10.3.6  │ Spill/Stack Write     │  0.00 │  0.00 │  0.00 │ Instr per kernel │
├─────────┼───────────────────────┼───────┼───────┼───────┼──────────────────┤
│ 10.3.7  │ Spill/Stack Atomic    │  0.00 │  0.00 │  0.00 │ Instr per kernel │
╘═════════╧═══════════════════════╧═══════╧═══════╧═══════╧══════════════════╛


--------------------------------------------------------------------------------
15. Address Processing Unit and Data Return Path (TA/TD)
15.1 Address Processing Unit
╒═════════╤═════════════════════════════╤═══════╤═══════╤═══════╤══════════════════╕
│ Index   │ Metric                      │   Avg │   Min │   Max │ Unit             │
╞═════════╪═════════════════════════════╪═══════╪═══════╪═══════╪══════════════════╡
│ 15.1.4  │ Total Instructions          │  1.00 │  1.00 │  1.00 │ Instr per kernel │
├─────────┼─────────────────────────────┼───────┼───────┼───────┼──────────────────┤
│ 15.1.5  │ Global/Generic Instr        │  1.00 │  1.00 │  1.00 │ Instr per kernel │
├─────────┼─────────────────────────────┼───────┼───────┼───────┼──────────────────┤
│ 15.1.6  │ Global/Generic Read Instr   │  0.00 │  0.00 │  0.00 │ Instr per kernel │
├─────────┼─────────────────────────────┼───────┼───────┼───────┼──────────────────┤
│ 15.1.7  │ Global/Generic Write Instr  │  1.00 │  1.00 │  1.00 │ Instr per kernel │
├─────────┼─────────────────────────────┼───────┼───────┼───────┼──────────────────┤
│ 15.1.8  │ Global/Generic Atomic Instr │  0.00 │  0.00 │  0.00 │ Instr per kernel │
├─────────┼─────────────────────────────┼───────┼───────┼───────┼──────────────────┤
│ 15.1.9  │ Spill/Stack Instr           │  0.00 │  0.00 │  0.00 │ Instr per kernel │
├─────────┼─────────────────────────────┼───────┼───────┼───────┼──────────────────┤
│ 15.1.10 │ Spill/Stack Read Instr      │  0.00 │  0.00 │  0.00 │ Instr per kernel │
├─────────┼─────────────────────────────┼───────┼───────┼───────┼──────────────────┤
│ 15.1.11 │ Spill/Stack Write Instr     │  0.00 │  0.00 │  0.00 │ Instr per kernel │
╘═════════╧═════════════════════════════╧═══════╧═══════╧═══════╧══════════════════╛
Here, we have presented both the information in the VMEM Instruction Mix table (10.3) and the Address Processing Unit (15.1). We note that this data is expected to be identical, and hence we omit table 15.1 in our subsequent examples.
In addition, as expected, we see a single Global/Generic write instruction (10.3.2, 15.1.7). Inspecting the generated assembly:
        .protected      _Z12global_writePii     ; -- Begin function _Z12global_writePii
        .globl  _Z12global_writePii
        .p2align        8
        .type   _Z12global_writePii,@function
_Z12global_writePii:                    ; @_Z12global_writePii
; %bb.0:
        s_load_dword s2, s[4:5], 0x8
        s_load_dwordx2 s[0:1], s[4:5], 0x0
        v_lshlrev_b32_e32 v0, 2, v0
        s_waitcnt lgkmcnt(0)
        v_mov_b32_e32 v1, s2
        global_store_dword v0, v1, s[0:1]
        s_endpgm
        .section        .rodata,#alloc
        .p2align        6, 0x0
        .amdhsa_kernel _Z12global_writePii
we see that this corresponds to an instance of a global_store_dword operation.
Note
The assembly in these experiments were generated for an MI2XX accelerator using ROCm 5.6.0, and may change depending on ROCm versions and the targeted hardware architecture
Generic Write to LDS
Next, we examine a generic write.
As discussed previously, our generic_write kernel uses an address space cast to force the compiler to choose our desired address space, regardless of other optimizations that may be possible.
We also note that the filter parameter passed in as a kernel argument (see example, or design note) is set to zero on the host, such that we always write to the ‘local’ (LDS) memory allocation lds.
Examining this kernel in the VMEM Instruction Mix table yields:
$ omniperf analyze -p workloads/vmem/mi200/ --dispatch 2 -b 10.3 -n per_kernel
<...>
0. Top Stat
╒════╤══════════════════════════════════════════╤═════════╤═══════════╤════════════╤══════════════╤════════╕
│    │ KernelName                               │   Count │   Sum(ns) │   Mean(ns) │   Median(ns) │    Pct │
╞════╪══════════════════════════════════════════╪═════════╪═══════════╪════════════╪══════════════╪════════╡
│  0 │ generic_write(int*, int, int) [clone .kd │    1.00 │   2880.00 │    2880.00 │      2880.00 │ 100.00 │
│    │ ]                                        │         │           │            │              │        │
╘════╧══════════════════════════════════════════╧═════════╧═══════════╧════════════╧══════════════╧════════╛


--------------------------------------------------------------------------------
10. Compute Units - Instruction Mix
10.3 VMEM Instr Mix
╒═════════╤═══════════════════════╤═══════╤═══════╤═══════╤══════════════════╕
│ Index   │ Metric                │   Avg │   Min │   Max │ Unit             │
╞═════════╪═══════════════════════╪═══════╪═══════╪═══════╪══════════════════╡
│ 10.3.0  │ Global/Generic Instr  │  1.00 │  1.00 │  1.00 │ Instr per kernel │
├─────────┼───────────────────────┼───────┼───────┼───────┼──────────────────┤
│ 10.3.1  │ Global/Generic Read   │  0.00 │  0.00 │  0.00 │ Instr per kernel │
├─────────┼───────────────────────┼───────┼───────┼───────┼──────────────────┤
│ 10.3.2  │ Global/Generic Write  │  1.00 │  1.00 │  1.00 │ Instr per kernel │
├─────────┼───────────────────────┼───────┼───────┼───────┼──────────────────┤
│ 10.3.3  │ Global/Generic Atomic │  0.00 │  0.00 │  0.00 │ Instr per kernel │
├─────────┼───────────────────────┼───────┼───────┼───────┼──────────────────┤
│ 10.3.4  │ Spill/Stack Instr     │  0.00 │  0.00 │  0.00 │ Instr per kernel │
├─────────┼───────────────────────┼───────┼───────┼───────┼──────────────────┤
│ 10.3.5  │ Spill/Stack Read      │  0.00 │  0.00 │  0.00 │ Instr per kernel │
├─────────┼───────────────────────┼───────┼───────┼───────┼──────────────────┤
│ 10.3.6  │ Spill/Stack Write     │  0.00 │  0.00 │  0.00 │ Instr per kernel │
├─────────┼───────────────────────┼───────┼───────┼───────┼──────────────────┤
│ 10.3.7  │ Spill/Stack Atomic    │  0.00 │  0.00 │  0.00 │ Instr per kernel │
╘═════════╧═══════════════════════╧═══════╧═══════╧═══════╧══════════════════╛
As expected we see a single generic write (10.3.2).
In the assembly generated for this kernel (in particular, we care about the generic_store function). We see that this corresponds to a flat_store_dword instruction:
        .type   _Z13generic_storePii,@function
_Z13generic_storePii:                   ; @_Z13generic_storePii
; %bb.0:
        s_waitcnt vmcnt(0) expcnt(0) lgkmcnt(0)
        flat_store_dword v[0:1], v2
        s_waitcnt vmcnt(0) lgkmcnt(0)
        s_setpc_b64 s[30:31]
.Lfunc_end0:
In addition, we note that we can observe the destination of this request by looking at the LDS Instructions metric (12.2.0):
$ omniperf analyze -p workloads/vmem/mi200/ --dispatch 2 -b 12.2.0 -n per_kernel
<...>
12. Local Data Share (LDS)
12.2 LDS Stats
╒═════════╤════════════╤═══════╤═══════╤═══════╤══════════════════╕
│ Index   │ Metric     │   Avg │   Min │   Max │ Unit             │
╞═════════╪════════════╪═══════╪═══════╪═══════╪══════════════════╡
│ 12.2.0  │ LDS Instrs │  1.00 │  1.00 │  1.00 │ Instr per kernel │
╘═════════╧════════════╧═══════╧═══════╧═══════╧══════════════════╛
which indicates one LDS access.
Note
Exercise for the reader: if this access had been targeted at global memory (e.g., by changing value of filter), where should we look for the memory traffic? Hint: see our generic read example.
Global read
Next, we examine a simple global read operation:
__global__ void global_read(int* ptr, int zero) {
  int x = ptr[threadIdx.x];
  if (x != zero) {
    ptr[threadIdx.x] = x + 1;
  }
}
Here we observe a now familiar pattern:
Read a value in from global memory
Have a write hidden behind a conditional that is impossible for the compiler to statically eliminate, but is identically false. In this case, our
main()function initializes the data inptrto zero.
Running Omniperf on this kernel yields:
$ omniperf analyze -p workloads/vmem/mi200/ --dispatch 3 -b 10.3 -n per_kernel
<...>
0. Top Stat
╒════╤════════════════════════════════════╤═════════╤═══════════╤════════════╤══════════════╤════════╕
│    │ KernelName                         │   Count │   Sum(ns) │   Mean(ns) │   Median(ns) │    Pct │
╞════╪════════════════════════════════════╪═════════╪═══════════╪════════════╪══════════════╪════════╡
│  0 │ global_read(int*, int) [clone .kd] │    1.00 │   4480.00 │    4480.00 │      4480.00 │ 100.00 │
╘════╧════════════════════════════════════╧═════════╧═══════════╧════════════╧══════════════╧════════╛


--------------------------------------------------------------------------------
10. Compute Units - Instruction Mix
10.3 VMEM Instr Mix
╒═════════╤═══════════════════════╤═══════╤═══════╤═══════╤══════════════════╕
│ Index   │ Metric                │   Avg │   Min │   Max │ Unit             │
╞═════════╪═══════════════════════╪═══════╪═══════╪═══════╪══════════════════╡
│ 10.3.0  │ Global/Generic Instr  │  1.00 │  1.00 │  1.00 │ Instr per kernel │
├─────────┼───────────────────────┼───────┼───────┼───────┼──────────────────┤
│ 10.3.1  │ Global/Generic Read   │  1.00 │  1.00 │  1.00 │ Instr per kernel │
├─────────┼───────────────────────┼───────┼───────┼───────┼──────────────────┤
│ 10.3.2  │ Global/Generic Write  │  0.00 │  0.00 │  0.00 │ Instr per kernel │
├─────────┼───────────────────────┼───────┼───────┼───────┼──────────────────┤
│ 10.3.3  │ Global/Generic Atomic │  0.00 │  0.00 │  0.00 │ Instr per kernel │
├─────────┼───────────────────────┼───────┼───────┼───────┼──────────────────┤
│ 10.3.4  │ Spill/Stack Instr     │  0.00 │  0.00 │  0.00 │ Instr per kernel │
├─────────┼───────────────────────┼───────┼───────┼───────┼──────────────────┤
│ 10.3.5  │ Spill/Stack Read      │  0.00 │  0.00 │  0.00 │ Instr per kernel │
├─────────┼───────────────────────┼───────┼───────┼───────┼──────────────────┤
│ 10.3.6  │ Spill/Stack Write     │  0.00 │  0.00 │  0.00 │ Instr per kernel │
├─────────┼───────────────────────┼───────┼───────┼───────┼──────────────────┤
│ 10.3.7  │ Spill/Stack Atomic    │  0.00 │  0.00 │  0.00 │ Instr per kernel │
╘═════════╧═══════════════════════╧═══════╧═══════╧═══════╧══════════════════╛
Here we see a single global/generic instruction (10.3.0) which, as expected, is a read (10.3.1).
Generic read from global memory
For our generic read example, we choose to change our target for the generic read to be global memory:
__global__ void generic_read(int* ptr, int zero, int filter) {
  __shared__ int lds[1024];
  if (static_cast<int>(filter - 1) == zero) {
    lds[threadIdx.x] = 0; // initialize to zero to avoid conditional, but hide behind _another_ conditional
  }
  int* generic;
  if (static_cast<int>(threadIdx.x) > filter - 1) {
    generic = &ptr[threadIdx.x];
  } else {
    generic = &lds[threadIdx.x];
    abort();
  }
  int x = generic_load((generic_ptr)generic);
  if (x != zero) {
    ptr[threadIdx.x] = x + 1;
  }
}
In addition to our usual if (condition_that_wont_happen) guard around the write operation, there is an additional conditional around the initialization of the lds buffer.
We note that it’s typically required to write to this buffer to prevent the compiler from eliminating the local memory branch entirely due to undefined behavior (use of an uninitialized value).
However, to report only our global memory read, we again hide this initialization behind an identically false conditional (both zero and filter are set to zero in the kernel launch). Note that this is a different conditional from our pointer assignment (to avoid combination of the two).
Running Omniperf on this kernel reports:
$ omniperf analyze -p workloads/vmem/mi200/ --dispatch 4 -b 10.3 12.2.0 16.3.10 -n per_kernel
<...>
0. Top Stat
╒════╤══════════════════════════════════════════╤═════════╤═══════════╤════════════╤══════════════╤════════╕
│    │ KernelName                               │   Count │   Sum(ns) │   Mean(ns) │   Median(ns) │    Pct │
╞════╪══════════════════════════════════════════╪═════════╪═══════════╪════════════╪══════════════╪════════╡
│  0 │ generic_read(int*, int, int) [clone .kd] │    1.00 │   2240.00 │    2240.00 │      2240.00 │ 100.00 │
╘════╧══════════════════════════════════════════╧═════════╧═══════════╧════════════╧══════════════╧════════╛


--------------------------------------------------------------------------------
10. Compute Units - Instruction Mix
10.3 VMEM Instr Mix
╒═════════╤═══════════════════════╤═══════╤═══════╤═══════╤══════════════════╕
│ Index   │ Metric                │   Avg │   Min │   Max │ Unit             │
╞═════════╪═══════════════════════╪═══════╪═══════╪═══════╪══════════════════╡
│ 10.3.0  │ Global/Generic Instr  │  1.00 │  1.00 │  1.00 │ Instr per kernel │
├─────────┼───────────────────────┼───────┼───────┼───────┼──────────────────┤
│ 10.3.1  │ Global/Generic Read   │  1.00 │  1.00 │  1.00 │ Instr per kernel │
├─────────┼───────────────────────┼───────┼───────┼───────┼──────────────────┤
│ 10.3.2  │ Global/Generic Write  │  0.00 │  0.00 │  0.00 │ Instr per kernel │
├─────────┼───────────────────────┼───────┼───────┼───────┼──────────────────┤
│ 10.3.3  │ Global/Generic Atomic │  0.00 │  0.00 │  0.00 │ Instr per kernel │
├─────────┼───────────────────────┼───────┼───────┼───────┼──────────────────┤
│ 10.3.4  │ Spill/Stack Instr     │  0.00 │  0.00 │  0.00 │ Instr per kernel │
├─────────┼───────────────────────┼───────┼───────┼───────┼──────────────────┤
│ 10.3.5  │ Spill/Stack Read      │  0.00 │  0.00 │  0.00 │ Instr per kernel │
├─────────┼───────────────────────┼───────┼───────┼───────┼──────────────────┤
│ 10.3.6  │ Spill/Stack Write     │  0.00 │  0.00 │  0.00 │ Instr per kernel │
├─────────┼───────────────────────┼───────┼───────┼───────┼──────────────────┤
│ 10.3.7  │ Spill/Stack Atomic    │  0.00 │  0.00 │  0.00 │ Instr per kernel │
╘═════════╧═══════════════════════╧═══════╧═══════╧═══════╧══════════════════╛


--------------------------------------------------------------------------------
12. Local Data Share (LDS)
12.2 LDS Stats
╒═════════╤════════════╤═══════╤═══════╤═══════╤══════════════════╕
│ Index   │ Metric     │   Avg │   Min │   Max │ Unit             │
╞═════════╪════════════╪═══════╪═══════╪═══════╪══════════════════╡
│ 12.2.0  │ LDS Instrs │  0.00 │  0.00 │  0.00 │ Instr per kernel │
╘═════════╧════════════╧═══════╧═══════╧═══════╧══════════════════╛


--------------------------------------------------------------------------------
16. Vector L1 Data Cache
16.3 L1D Cache Accesses
╒═════════╤════════════╤═══════╤═══════╤═══════╤════════════════╕
│ Index   │ Metric     │   Avg │   Min │   Max │ Unit           │
╞═════════╪════════════╪═══════╪═══════╪═══════╪════════════════╡
│ 16.3.10 │ L1-L2 Read │  1.00 │  1.00 │  1.00 │ Req per kernel │
╘═════════╧════════════╧═══════╧═══════╧═══════╧════════════════╛
Here we observe:
A single global/generic read operation (10.3.1), which
Is not an LDS instruction (12.2), as seen in our generic write example, but is instead
An L1-L2 read operation (16.3.10)
That is, we have successfully targeted our generic read at global memory.
Inspecting the assembly shows this corresponds to a flat_load_dword instruction.
Global atomic
Our global atomic kernel:
__global__ void global_atomic(int* ptr, int zero) {
  atomicAdd(ptr, zero);
}
simply atomically adds a (non-compile-time) zero value to a pointer.
Running Omniperf on this kernel yields:
$ omniperf analyze -p workloads/vmem/mi200/ --dispatch 5 -b 10.3 16.3.12 -n per_kernel
<...>
0. Top Stat
╒════╤══════════════════════════════════════╤═════════╤═══════════╤════════════╤══════════════╤════════╕
│    │ KernelName                           │   Count │   Sum(ns) │   Mean(ns) │   Median(ns) │    Pct │
╞════╪══════════════════════════════════════╪═════════╪═══════════╪════════════╪══════════════╪════════╡
│  0 │ global_atomic(int*, int) [clone .kd] │    1.00 │   4640.00 │    4640.00 │      4640.00 │ 100.00 │
╘════╧══════════════════════════════════════╧═════════╧═══════════╧════════════╧══════════════╧════════╛


--------------------------------------------------------------------------------
10. Compute Units - Instruction Mix
10.3 VMEM Instr Mix
╒═════════╤═══════════════════════╤═══════╤═══════╤═══════╤══════════════════╕
│ Index   │ Metric                │   Avg │   Min │   Max │ Unit             │
╞═════════╪═══════════════════════╪═══════╪═══════╪═══════╪══════════════════╡
│ 10.3.0  │ Global/Generic Instr  │  1.00 │  1.00 │  1.00 │ Instr per kernel │
├─────────┼───────────────────────┼───────┼───────┼───────┼──────────────────┤
│ 10.3.1  │ Global/Generic Read   │  0.00 │  0.00 │  0.00 │ Instr per kernel │
├─────────┼───────────────────────┼───────┼───────┼───────┼──────────────────┤
│ 10.3.2  │ Global/Generic Write  │  0.00 │  0.00 │  0.00 │ Instr per kernel │
├─────────┼───────────────────────┼───────┼───────┼───────┼──────────────────┤
│ 10.3.3  │ Global/Generic Atomic │  1.00 │  1.00 │  1.00 │ Instr per kernel │
├─────────┼───────────────────────┼───────┼───────┼───────┼──────────────────┤
│ 10.3.4  │ Spill/Stack Instr     │  0.00 │  0.00 │  0.00 │ Instr per kernel │
├─────────┼───────────────────────┼───────┼───────┼───────┼──────────────────┤
│ 10.3.5  │ Spill/Stack Read      │  0.00 │  0.00 │  0.00 │ Instr per kernel │
├─────────┼───────────────────────┼───────┼───────┼───────┼──────────────────┤
│ 10.3.6  │ Spill/Stack Write     │  0.00 │  0.00 │  0.00 │ Instr per kernel │
├─────────┼───────────────────────┼───────┼───────┼───────┼──────────────────┤
│ 10.3.7  │ Spill/Stack Atomic    │  0.00 │  0.00 │  0.00 │ Instr per kernel │
╘═════════╧═══════════════════════╧═══════╧═══════╧═══════╧══════════════════╛


--------------------------------------------------------------------------------
16. Vector L1 Data Cache
16.3 L1D Cache Accesses
╒═════════╤══════════════╤═══════╤═══════╤═══════╤════════════════╕
│ Index   │ Metric       │   Avg │   Min │   Max │ Unit           │
╞═════════╪══════════════╪═══════╪═══════╪═══════╪════════════════╡
│ 16.3.12 │ L1-L2 Atomic │  1.00 │  1.00 │  1.00 │ Req per kernel │
╘═════════╧══════════════╧═══════╧═══════╧═══════╧════════════════╛
Here we see a single global/generic atomic instruction (10.3.3), which corresponds to an L1-L2 atomic request (16.3.12).
Generic, mixed atomic
In our final global/generic example, we look at a case where our generic operation targets both LDS and global memory:
__global__ void generic_atomic(int* ptr, int filter, int zero) {
  __shared__ int lds[1024];
  int* generic = (threadIdx.x % 2 == filter) ? &ptr[threadIdx.x] : &lds[threadIdx.x];
  generic_atomic((generic_ptr)generic, zero);
}
This assigns every other work-item to atomically update global memory or local memory.
Running this kernel through Omniperf shows:
$ omniperf analyze -p workloads/vmem/mi200/ --dispatch 6 -b 10.3 12.2.0 16.3.12 -n per_kernel
<...>
0. Top Stat
╒════╤══════════════════════════════════════════╤═════════╤═══════════╤════════════╤══════════════╤════════╕
│    │ KernelName                               │   Count │   Sum(ns) │   Mean(ns) │   Median(ns) │    Pct │
╞════╪══════════════════════════════════════════╪═════════╪═══════════╪════════════╪══════════════╪════════╡
│  0 │ generic_atomic(int*, int, int) [clone .k │    1.00 │   3360.00 │    3360.00 │      3360.00 │ 100.00 │
│    │ d]                                       │         │           │            │              │        │
╘════╧══════════════════════════════════════════╧═════════╧═══════════╧════════════╧══════════════╧════════╛


10. Compute Units - Instruction Mix
10.3 VMEM Instr Mix
╒═════════╤═══════════════════════╤═══════╤═══════╤═══════╤══════════════════╕
│ Index   │ Metric                │   Avg │   Min │   Max │ Unit             │
╞═════════╪═══════════════════════╪═══════╪═══════╪═══════╪══════════════════╡
│ 10.3.0  │ Global/Generic Instr  │  1.00 │  1.00 │  1.00 │ Instr per kernel │
├─────────┼───────────────────────┼───────┼───────┼───────┼──────────────────┤
│ 10.3.1  │ Global/Generic Read   │  0.00 │  0.00 │  0.00 │ Instr per kernel │
├─────────┼───────────────────────┼───────┼───────┼───────┼──────────────────┤
│ 10.3.2  │ Global/Generic Write  │  0.00 │  0.00 │  0.00 │ Instr per kernel │
├─────────┼───────────────────────┼───────┼───────┼───────┼──────────────────┤
│ 10.3.3  │ Global/Generic Atomic │  1.00 │  1.00 │  1.00 │ Instr per kernel │
├─────────┼───────────────────────┼───────┼───────┼───────┼──────────────────┤
│ 10.3.4  │ Spill/Stack Instr     │  0.00 │  0.00 │  0.00 │ Instr per kernel │
├─────────┼───────────────────────┼───────┼───────┼───────┼──────────────────┤
│ 10.3.5  │ Spill/Stack Read      │  0.00 │  0.00 │  0.00 │ Instr per kernel │
├─────────┼───────────────────────┼───────┼───────┼───────┼──────────────────┤
│ 10.3.6  │ Spill/Stack Write     │  0.00 │  0.00 │  0.00 │ Instr per kernel │
├─────────┼───────────────────────┼───────┼───────┼───────┼──────────────────┤
│ 10.3.7  │ Spill/Stack Atomic    │  0.00 │  0.00 │  0.00 │ Instr per kernel │
╘═════════╧═══════════════════════╧═══════╧═══════╧═══════╧══════════════════╛


--------------------------------------------------------------------------------
12. Local Data Share (LDS)
12.2 LDS Stats
╒═════════╤════════════╤═══════╤═══════╤═══════╤══════════════════╕
│ Index   │ Metric     │   Avg │   Min │   Max │ Unit             │
╞═════════╪════════════╪═══════╪═══════╪═══════╪══════════════════╡
│ 12.2.0  │ LDS Instrs │  1.00 │  1.00 │  1.00 │ Instr per kernel │
╘═════════╧════════════╧═══════╧═══════╧═══════╧══════════════════╛


--------------------------------------------------------------------------------
16. Vector L1 Data Cache
16.3 L1D Cache Accesses
╒═════════╤══════════════╤═══════╤═══════╤═══════╤════════════════╕
│ Index   │ Metric       │   Avg │   Min │   Max │ Unit           │
╞═════════╪══════════════╪═══════╪═══════╪═══════╪════════════════╡
│ 16.3.12 │ L1-L2 Atomic │  1.00 │  1.00 │  1.00 │ Req per kernel │
╘═════════╧══════════════╧═══════╧═══════╧═══════╧════════════════╛
That is, we see:
A single generic atomic instruction (10.3.3) that maps to both
an LDS instruction (12.2.0), and
an L1-L2 atomic request (16.3)
We have demonstrated the ability of the generic address space to dynamically target different backing memory!
Spill/Scratch (BUFFER)
Next we examine the use of ‘Spill/Scratch’ memory.
On current CDNA accelerators such as the MI2XX, this is implemented using the private memory space, which maps to ‘scratch’ memory in AMDGPU hardware terminology.
This type of memory can be accessed via different instructions depending on the specific architecture targeted. However, current CDNA accelerators such as the MI2XX use so called buffer instructions to access private memory in a simple (and typically) coalesced manner. See Sec. 9.1, ‘Vector Memory Buffer Instructions’ of the CDNA2 ISA guide for further reading on this instruction type.
We develop a simple kernel that uses stack memory:
#include <hip/hip_runtime.h>
__global__ void knl(int* out, int filter) {
  int x[1024];
  x[filter] = 0;
  if (threadIdx.x < filter)
    out[threadIdx.x] = x[threadIdx.x];
}
Our strategy here is to:
Create a large stack buffer (that cannot reasonably fit into registers)
Write to a compile-time unknown location on the stack, and then
Behind the typical compile-time unknown
if(condition_that_wont_happen)Read from a different, compile-time unknown, location on the stack and write to global memory to prevent the compiler from optimizing it out.
This example was compiled and run on an MI250 accelerator using ROCm v5.6.0, and Omniperf v2.0.0.
$ hipcc -O3 stack.hip -o stack.hip
and profiled using omniperf:
$ omniperf profile -n stack --no-roof -- ./stack
<...>
$ omniperf analyze -p workloads/stack/mi200/  -b 10.3 16.3.11 -n per_kernel
<...>
10. Compute Units - Instruction Mix
10.3 VMEM Instr Mix
╒═════════╤═══════════════════════╤═══════╤═══════╤═══════╤══════════════════╕
│ Index   │ Metric                │   Avg │   Min │   Max │ Unit             │
╞═════════╪═══════════════════════╪═══════╪═══════╪═══════╪══════════════════╡
│ 10.3.0  │ Global/Generic Instr  │  0.00 │  0.00 │  0.00 │ Instr per kernel │
├─────────┼───────────────────────┼───────┼───────┼───────┼──────────────────┤
│ 10.3.1  │ Global/Generic Read   │  0.00 │  0.00 │  0.00 │ Instr per kernel │
├─────────┼───────────────────────┼───────┼───────┼───────┼──────────────────┤
│ 10.3.2  │ Global/Generic Write  │  0.00 │  0.00 │  0.00 │ Instr per kernel │
├─────────┼───────────────────────┼───────┼───────┼───────┼──────────────────┤
│ 10.3.3  │ Global/Generic Atomic │  0.00 │  0.00 │  0.00 │ Instr per kernel │
├─────────┼───────────────────────┼───────┼───────┼───────┼──────────────────┤
│ 10.3.4  │ Spill/Stack Instr     │  1.00 │  1.00 │  1.00 │ Instr per kernel │
├─────────┼───────────────────────┼───────┼───────┼───────┼──────────────────┤
│ 10.3.5  │ Spill/Stack Read      │  0.00 │  0.00 │  0.00 │ Instr per kernel │
├─────────┼───────────────────────┼───────┼───────┼───────┼──────────────────┤
│ 10.3.6  │ Spill/Stack Write     │  1.00 │  1.00 │  1.00 │ Instr per kernel │
├─────────┼───────────────────────┼───────┼───────┼───────┼──────────────────┤
│ 10.3.7  │ Spill/Stack Atomic    │  0.00 │  0.00 │  0.00 │ Instr per kernel │
╘═════════╧═══════════════════════╧═══════╧═══════╧═══════╧══════════════════╛


--------------------------------------------------------------------------------
16. Vector L1 Data Cache
16.3 L1D Cache Accesses
╒═════════╤═════════════╤═══════╤═══════╤═══════╤════════════════╕
│ Index   │ Metric      │   Avg │   Min │   Max │ Unit           │
╞═════════╪═════════════╪═══════╪═══════╪═══════╪════════════════╡
│ 16.3.11 │ L1-L2 Write │  1.00 │  1.00 │  1.00 │ Req per kernel │
╘═════════╧═════════════╧═══════╧═══════╧═══════╧════════════════╛
Here we see a single write to the stack (10.3.6), which corresponds to an L1-L2 write request (16.3.11), i.e., the stack is backed by global memory and travels through the same memory hierarchy.
Instructions-per-cycle and Utilizations example
For this section, we use the instructions-per-cycle (IPC) example included with Omniperf.
This example is compiled using c++17 support:
$ hipcc -O3 ipc.hip -o ipc -std=c++17
and was run on an MI250 CDNA2 accelerator:
$ omniperf profile -n ipc --no-roof -- ./ipc
The results shown in this section are generally applicable to CDNA accelerators, but may vary between generations and specific products.
Design note
The kernels in this example all execute a specific assembly operation N times (1000, by default), for instance the vmov kernel:
template<int N=1000>
__device__ void vmov_op() {
    int dummy;
    if constexpr (N >= 1) {
        asm volatile("v_mov_b32 v0, v1\n" : : "{v31}"(dummy));
        vmov_op<N - 1>();
    }
}

template<int N=1000>
__global__ void vmov() {
    vmov_op<N>();
}
The kernels are then launched twice, once for a warm-up run, and once for measurement.
VALU Utilization and IPC
Now we can use our test to measure the achieved instructions-per-cycle of various types of instructions.
We start with a simple VALU operation, i.e., a v_mov_b32 instruction, e.g.:
v_mov_b32 v0, v1
This instruction simply copies the contents from the source register (v1) to the destination register (v0).
Investigating this kernel with Omniperf, we see:
$ omniperf analyze -p workloads/ipc/mi200/ --dispatch 7 -b 11.2
<...>
--------------------------------------------------------------------------------
0. Top Stat
╒════╤═══════════════════════════════╤═════════╤═════════════╤═════════════╤══════════════╤════════╕
│    │ KernelName                    │   Count │     Sum(ns) │    Mean(ns) │   Median(ns) │    Pct │
╞════╪═══════════════════════════════╪═════════╪═════════════╪═════════════╪══════════════╪════════╡
│  0 │ void vmov<1000>() [clone .kd] │    1.00 │ 99317423.00 │ 99317423.00 │  99317423.00 │ 100.00 │
╘════╧═══════════════════════════════╧═════════╧═════════════╧═════════════╧══════════════╧════════╛


--------------------------------------------------------------------------------
11. Compute Units - Compute Pipeline
11.2 Pipeline Stats
╒═════════╤═════════════════════╤═══════╤═══════╤═══════╤══════════════╕
│ Index   │ Metric              │ Avg   │ Min   │ Max   │ Unit         │
╞═════════╪═════════════════════╪═══════╪═══════╪═══════╪══════════════╡
│ 11.2.0  │ IPC                 │ 1.0   │ 1.0   │ 1.0   │ Instr/cycle  │
├─────────┼─────────────────────┼───────┼───────┼───────┼──────────────┤
│ 11.2.1  │ IPC (Issued)        │ 1.0   │ 1.0   │ 1.0   │ Instr/cycle  │
├─────────┼─────────────────────┼───────┼───────┼───────┼──────────────┤
│ 11.2.2  │ SALU Util           │ 0.0   │ 0.0   │ 0.0   │ Pct          │
├─────────┼─────────────────────┼───────┼───────┼───────┼──────────────┤
│ 11.2.3  │ VALU Util           │ 99.98 │ 99.98 │ 99.98 │ Pct          │
├─────────┼─────────────────────┼───────┼───────┼───────┼──────────────┤
│ 11.2.4  │ VMEM Util           │ 0.0   │ 0.0   │ 0.0   │ Pct          │
├─────────┼─────────────────────┼───────┼───────┼───────┼──────────────┤
│ 11.2.5  │ Branch Util         │ 0.1   │ 0.1   │ 0.1   │ Pct          │
├─────────┼─────────────────────┼───────┼───────┼───────┼──────────────┤
│ 11.2.6  │ VALU Active Threads │ 64.0  │ 64.0  │ 64.0  │ Threads      │
├─────────┼─────────────────────┼───────┼───────┼───────┼──────────────┤
│ 11.2.7  │ MFMA Util           │ 0.0   │ 0.0   │ 0.0   │ Pct          │
├─────────┼─────────────────────┼───────┼───────┼───────┼──────────────┤
│ 11.2.8  │ MFMA Instr Cycles   │       │       │       │ Cycles/instr │
╘═════════╧═════════════════════╧═══════╧═══════╧═══════╧══════════════╛
Here we see that:
Both the IPC (11.2.0) and “Issued” IPC (11.2.1) metrics are \(\sim 1\)
The VALU Utilization metric (11.2.3) is also \(\sim100\%\), and finally
The VALU Active Threads metric (11.2.4) is 64, i.e., the wavefront size on CDNA accelerators, as all threads in the wavefront are active.
We will explore the difference between the IPC (11.2.0) and “Issued” IPC (11.2.1) metrics in the next section.
Additionally, we notice a small (0.1%) Branch utilization (11.2.5). Inspecting the assembly of this kernel shows there are no branch operations, however recalling the note in the Pipeline statistics section:
the Branch utilization <…> includes time spent in other instruction types (namely:
s_endpgm) that are typically a very small percentage of the overall kernel execution.
we see that this is coming from execution of the s_endpgm instruction at the end of every wavefront.
Note
Technically, the cycle counts used in the denominators of our IPC metrics are actually in units of quad-cycles, a group of 4 consecutive cycles. However, a typical VALU instruction on CDNA accelerators runs for a single quad-cycle (see Layla Mah’s GCN Crash Course, slide 30). Therefore, for simplicity, we simply report these metrics as “instructions per cycle”.
Exploring “Issued” IPC via MFMA operations
Warning
The MFMA assembly operations used in this example are inherently unportable to older CDNA architectures.
Unlike the simple quad-cycle v_mov_b32 operation discussed in our previous example, some operations take many quad-cycles to execute.
For example, using the AMD Matrix Instruction Calculator we can see that some MFMA operations take 64 cycles, e.g.:
$ ./matrix_calculator.py --arch CDNA2 --detail-instruction --instruction v_mfma_f32_32x32x8bf16_1k
Architecture: CDNA2
Instruction: V_MFMA_F32_32X32X8BF16_1K
<...>
    Execution statistics:
        FLOPs: 16384
        Execution cycles: 64
        FLOPs/CU/cycle: 1024
        Can co-execute with VALU: True
        VALU co-execution cycles possible: 60
What happens to our IPC when we utilize this v_mfma_f32_32x32x8bf16_1k instruction on a CDNA2 accelerator?
To find out, we turn to our mfma kernel in the IPC example:
$ omniperf analyze -p workloads/ipc/mi200/ --dispatch 8 -b 11.2 --decimal 4
<...>
--------------------------------------------------------------------------------
0. Top Stat
╒════╤═══════════════════════════════╤═════════╤═════════════════╤═════════════════╤═════════════════╤══════════╕
│    │ KernelName                    │   Count │         Sum(ns) │        Mean(ns) │      Median(ns) │      Pct │
╞════╪═══════════════════════════════╪═════════╪═════════════════╪═════════════════╪═════════════════╪══════════╡
│  0 │ void mfma<1000>() [clone .kd] │  1.0000 │ 1623167595.0000 │ 1623167595.0000 │ 1623167595.0000 │ 100.0000 │
╘════╧═══════════════════════════════╧═════════╧═════════════════╧═════════════════╧═════════════════╧══════════╛


--------------------------------------------------------------------------------
11. Compute Units - Compute Pipeline
11.2 Pipeline Stats
╒═════════╤═════════════════════╤═════════╤═════════╤═════════╤══════════════╕
│ Index   │ Metric              │     Avg │     Min │     Max │ Unit         │
╞═════════╪═════════════════════╪═════════╪═════════╪═════════╪══════════════╡
│ 11.2.0  │ IPC                 │  0.0626 │  0.0626 │  0.0626 │ Instr/cycle  │
├─────────┼─────────────────────┼─────────┼─────────┼─────────┼──────────────┤
│ 11.2.1  │ IPC (Issued)        │  1.0000 │  1.0000 │  1.0000 │ Instr/cycle  │
├─────────┼─────────────────────┼─────────┼─────────┼─────────┼──────────────┤
│ 11.2.2  │ SALU Util           │  0.0000 │  0.0000 │  0.0000 │ Pct          │
├─────────┼─────────────────────┼─────────┼─────────┼─────────┼──────────────┤
│ 11.2.3  │ VALU Util           │  6.2496 │  6.2496 │  6.2496 │ Pct          │
├─────────┼─────────────────────┼─────────┼─────────┼─────────┼──────────────┤
│ 11.2.4  │ VMEM Util           │  0.0000 │  0.0000 │  0.0000 │ Pct          │
├─────────┼─────────────────────┼─────────┼─────────┼─────────┼──────────────┤
│ 11.2.5  │ Branch Util         │  0.0062 │  0.0062 │  0.0062 │ Pct          │
├─────────┼─────────────────────┼─────────┼─────────┼─────────┼──────────────┤
│ 11.2.6  │ VALU Active Threads │ 64.0000 │ 64.0000 │ 64.0000 │ Threads      │
├─────────┼─────────────────────┼─────────┼─────────┼─────────┼──────────────┤
│ 11.2.7  │ MFMA Util           │ 99.9939 │ 99.9939 │ 99.9939 │ Pct          │
├─────────┼─────────────────────┼─────────┼─────────┼─────────┼──────────────┤
│ 11.2.8  │ MFMA Instr Cycles   │ 64.0000 │ 64.0000 │ 64.0000 │ Cycles/instr │
╘═════════╧═════════════════════╧═════════╧═════════╧═════════╧══════════════╛
In contrast to our VALU IPC example, we now see that the IPC metric (11.2.0) and Issued IPC (11.2.1) metric differ substantially. First, we see the VALU utilization (11.2.3) has decreased substantially, from nearly 100% to \(\sim6.25\%\). We note that this matches the ratio of:
reported by the matrix calculator, while the MFMA utilization (11.2.7) has increased to nearly 100%.
Recall: our v_mfma_f32_32x32x8bf16_1k instruction takes 64 cycles to execute, or 16 quad-cycles, matching our observed MFMA Instruction Cycles (11.2.8).
That is, we have a single instruction executed every 16 quad-cycles, or:
which is almost identical to our IPC metric (11.2.0). Why then is the Issued IPC metric (11.2.1) equal to 1.0 then?
Instead of simply counting the number of instructions issued and dividing by the number of cycles the CUs on the accelerator were active (as is done for 11.2.0), this metric is formulated differently, and instead counts the number of (non-internal) instructions issued divided by the number of (quad-) cycles where the scheduler was actively working on issuing instructions. Thus the Issued IPC metric (11.2.1) gives more of a sense of “what percent of the total number of scheduler cycles did a wave schedule an instruction?” while the IPC metric (11.2.0) indicates the ratio of the number of instructions executed over the total active CU cycles.
Warning
There are further complications of the Issued IPC metric (11.2.1) that make its use more complicated. We will be explore that in the subsequent section. For these reasons, Omniperf typically promotes use of the regular IPC metric (11.2.0), e.g., in the top-level Speed-of-Light chart.
“Internal” instructions and IPC
Next, we explore the concept of an “internal” instruction.
From Layla Mah’s GCN Crash Course (slide 29), we see a few candidates for internal instructions, and we choose a s_nop instruction, which according to the CDNA2 ISA Guide:
Does nothing; it can be repeated in hardware up to eight times.
Here we choose to use a no-op of:
s_nop 0x0
to make our point. Running this kernel through Omniperf yields:
$ omniperf analyze -p workloads/ipc/mi200/ --dispatch 9 -b 11.2
<...>
--------------------------------------------------------------------------------
0. Top Stat
╒════╤═══════════════════════════════╤═════════╤═════════════╤═════════════╤══════════════╤════════╕
│    │ KernelName                    │   Count │     Sum(ns) │    Mean(ns) │   Median(ns) │    Pct │
╞════╪═══════════════════════════════╪═════════╪═════════════╪═════════════╪══════════════╪════════╡
│  0 │ void snop<1000>() [clone .kd] │    1.00 │ 14221851.50 │ 14221851.50 │  14221851.50 │ 100.00 │
╘════╧═══════════════════════════════╧═════════╧═════════════╧═════════════╧══════════════╧════════╛


--------------------------------------------------------------------------------
11. Compute Units - Compute Pipeline
11.2 Pipeline Stats
╒═════════╤═════════════════════╤═══════╤═══════╤═══════╤══════════════╕
│ Index   │ Metric              │ Avg   │ Min   │ Max   │ Unit         │
╞═════════╪═════════════════════╪═══════╪═══════╪═══════╪══════════════╡
│ 11.2.0  │ IPC                 │ 6.79  │ 6.79  │ 6.79  │ Instr/cycle  │
├─────────┼─────────────────────┼───────┼───────┼───────┼──────────────┤
│ 11.2.1  │ IPC (Issued)        │ 1.0   │ 1.0   │ 1.0   │ Instr/cycle  │
├─────────┼─────────────────────┼───────┼───────┼───────┼──────────────┤
│ 11.2.2  │ SALU Util           │ 0.0   │ 0.0   │ 0.0   │ Pct          │
├─────────┼─────────────────────┼───────┼───────┼───────┼──────────────┤
│ 11.2.3  │ VALU Util           │ 0.0   │ 0.0   │ 0.0   │ Pct          │
├─────────┼─────────────────────┼───────┼───────┼───────┼──────────────┤
│ 11.2.4  │ VMEM Util           │ 0.0   │ 0.0   │ 0.0   │ Pct          │
├─────────┼─────────────────────┼───────┼───────┼───────┼──────────────┤
│ 11.2.5  │ Branch Util         │ 0.68  │ 0.68  │ 0.68  │ Pct          │
├─────────┼─────────────────────┼───────┼───────┼───────┼──────────────┤
│ 11.2.6  │ VALU Active Threads │       │       │       │ Threads      │
├─────────┼─────────────────────┼───────┼───────┼───────┼──────────────┤
│ 11.2.7  │ MFMA Util           │ 0.0   │ 0.0   │ 0.0   │ Pct          │
├─────────┼─────────────────────┼───────┼───────┼───────┼──────────────┤
│ 11.2.8  │ MFMA Instr Cycles   │       │       │       │ Cycles/instr │
╘═════════╧═════════════════════╧═══════╧═══════╧═══════╧══════════════╛
First, we see that the IPC metric (11.2.0) tops our theoretical maximum of 5 instructions per cycle (discussed in the scheduler section). How can this be?
Recall that Layla’s slides say “no functional unit” for the internal instructions. This removes the limitation on the IPC. If we are only issuing internal instructions, we are not issuing to any execution units! However, workloads such as these are almost entirely artificial (i.e., repeatedly issuing internal instructions almost exclusively). In practice, a maximum of IPC of 5 is expected in almost all cases.
Secondly, we note that our “Issued” IPC (11.2.1) is still identical to one here.
Again, this has to do with the details of “internal” instructions.
Recall in our previous example we defined this metric as explicitly excluding internal instruction counts.
The logical question then is, ‘what is this metric counting in our s_nop kernel?’
The generated assembly looks something like:
;;#ASMSTART
s_nop 0x0
;;#ASMEND
;;#ASMSTART
s_nop 0x0
;;#ASMEND
;;<... omitting many more ...>
s_endpgm
.section        .rodata,#alloc
.p2align        6, 0x0
.amdhsa_kernel _Z4snopILi1000EEvv
Of particular interest here is the s_endpgm instruction, of which the CDNA2 ISA guide states:
End of program; terminate wavefront.
This is not on our list of internal instructions from Layla’s tutorial, and is therefore counted as part of our Issued IPC (11.2.1).
Thus: the issued IPC being equal to one here indicates that we issued an s_endpgm instruction every cycle the scheduler was active for non-internal instructions, which is expected as this was our only non-internal instruction!
SALU Utilization
Next, we explore a simple SALU kernel in our on-going IPC and utilization example. For this case, we select a simple scalar move operation, e.g.:
s_mov_b32 s0, s1
which, in analogue to our v_mov example, copies the contents of the source scalar register (s1) to the destination scalar register (s0).
Running this kernel through Omniperf yields:
$ omniperf analyze -p workloads/ipc/mi200/ --dispatch 10 -b 11.2
<...>
--------------------------------------------------------------------------------
0. Top Stat
╒════╤═══════════════════════════════╤═════════╤═════════════╤═════════════╤══════════════╤════════╕
│    │ KernelName                    │   Count │     Sum(ns) │    Mean(ns) │   Median(ns) │    Pct │
╞════╪═══════════════════════════════╪═════════╪═════════════╪═════════════╪══════════════╪════════╡
│  0 │ void smov<1000>() [clone .kd] │    1.00 │ 96246554.00 │ 96246554.00 │  96246554.00 │ 100.00 │
╘════╧═══════════════════════════════╧═════════╧═════════════╧═════════════╧══════════════╧════════╛


--------------------------------------------------------------------------------
11. Compute Units - Compute Pipeline
11.2 Pipeline Stats
╒═════════╤═════════════════════╤═══════╤═══════╤═══════╤══════════════╕
│ Index   │ Metric              │ Avg   │ Min   │ Max   │ Unit         │
╞═════════╪═════════════════════╪═══════╪═══════╪═══════╪══════════════╡
│ 11.2.0  │ IPC                 │ 1.0   │ 1.0   │ 1.0   │ Instr/cycle  │
├─────────┼─────────────────────┼───────┼───────┼───────┼──────────────┤
│ 11.2.1  │ IPC (Issued)        │ 1.0   │ 1.0   │ 1.0   │ Instr/cycle  │
├─────────┼─────────────────────┼───────┼───────┼───────┼──────────────┤
│ 11.2.2  │ SALU Util           │ 99.98 │ 99.98 │ 99.98 │ Pct          │
├─────────┼─────────────────────┼───────┼───────┼───────┼──────────────┤
│ 11.2.3  │ VALU Util           │ 0.0   │ 0.0   │ 0.0   │ Pct          │
├─────────┼─────────────────────┼───────┼───────┼───────┼──────────────┤
│ 11.2.4  │ VMEM Util           │ 0.0   │ 0.0   │ 0.0   │ Pct          │
├─────────┼─────────────────────┼───────┼───────┼───────┼──────────────┤
│ 11.2.5  │ Branch Util         │ 0.1   │ 0.1   │ 0.1   │ Pct          │
├─────────┼─────────────────────┼───────┼───────┼───────┼──────────────┤
│ 11.2.6  │ VALU Active Threads │       │       │       │ Threads      │
├─────────┼─────────────────────┼───────┼───────┼───────┼──────────────┤
│ 11.2.7  │ MFMA Util           │ 0.0   │ 0.0   │ 0.0   │ Pct          │
├─────────┼─────────────────────┼───────┼───────┼───────┼──────────────┤
│ 11.2.8  │ MFMA Instr Cycles   │       │       │       │ Cycles/instr │
╘═════════╧═════════════════════╧═══════╧═══════╧═══════╧══════════════╛
Here we see that:
both our IPC (11.2.0) and Issued IPC (11.2.1) are \(\sim1.0\) as expected, and,
the SALU Utilization (11.2.2) was nearly 100% as it was active for almost the entire kernel.
VALU Active Threads
For our final IPC/Utilization example, we consider a slight modification of our v_mov example:
template<int N=1000>
__global__ void vmov_with_divergence() {
    if (threadIdx.x % 64 == 0)
        vmov_op<N>();
}
That is, we wrap our VALU operation inside a conditional where only one lane in our wavefront is active. Running this kernel through Omniperf yields:
$ omniperf analyze -p workloads/ipc/mi200/ --dispatch 11 -b 11.2
<...>
--------------------------------------------------------------------------------
0. Top Stat
╒════╤══════════════════════════════════════════╤═════════╤═════════════╤═════════════╤══════════════╤════════╕
│    │ KernelName                               │   Count │     Sum(ns) │    Mean(ns) │   Median(ns) │    Pct │
╞════╪══════════════════════════════════════════╪═════════╪═════════════╪═════════════╪══════════════╪════════╡
│  0 │ void vmov_with_divergence<1000>() [clone │    1.00 │ 97125097.00 │ 97125097.00 │  97125097.00 │ 100.00 │
│    │  .kd]                                    │         │             │             │              │        │
╘════╧══════════════════════════════════════════╧═════════╧═════════════╧═════════════╧══════════════╧════════╛


--------------------------------------------------------------------------------
11. Compute Units - Compute Pipeline
11.2 Pipeline Stats
╒═════════╤═════════════════════╤═══════╤═══════╤═══════╤══════════════╕
│ Index   │ Metric              │ Avg   │ Min   │ Max   │ Unit         │
╞═════════╪═════════════════════╪═══════╪═══════╪═══════╪══════════════╡
│ 11.2.0  │ IPC                 │ 1.0   │ 1.0   │ 1.0   │ Instr/cycle  │
├─────────┼─────────────────────┼───────┼───────┼───────┼──────────────┤
│ 11.2.1  │ IPC (Issued)        │ 1.0   │ 1.0   │ 1.0   │ Instr/cycle  │
├─────────┼─────────────────────┼───────┼───────┼───────┼──────────────┤
│ 11.2.2  │ SALU Util           │ 0.1   │ 0.1   │ 0.1   │ Pct          │
├─────────┼─────────────────────┼───────┼───────┼───────┼──────────────┤
│ 11.2.3  │ VALU Util           │ 99.98 │ 99.98 │ 99.98 │ Pct          │
├─────────┼─────────────────────┼───────┼───────┼───────┼──────────────┤
│ 11.2.4  │ VMEM Util           │ 0.0   │ 0.0   │ 0.0   │ Pct          │
├─────────┼─────────────────────┼───────┼───────┼───────┼──────────────┤
│ 11.2.5  │ Branch Util         │ 0.2   │ 0.2   │ 0.2   │ Pct          │
├─────────┼─────────────────────┼───────┼───────┼───────┼──────────────┤
│ 11.2.6  │ VALU Active Threads │ 1.13  │ 1.13  │ 1.13  │ Threads      │
├─────────┼─────────────────────┼───────┼───────┼───────┼──────────────┤
│ 11.2.7  │ MFMA Util           │ 0.0   │ 0.0   │ 0.0   │ Pct          │
├─────────┼─────────────────────┼───────┼───────┼───────┼──────────────┤
│ 11.2.8  │ MFMA Instr Cycles   │       │       │       │ Cycles/instr │
╘═════════╧═════════════════════╧═══════╧═══════╧═══════╧══════════════╛
Here we see that once again, our VALU Utilization (11.2.3) is nearly 100%. However, we note that the VALU Active Threads metric (11.2.6) is \(\sim 1\), which matches our conditional in the source code. So VALU Active Threads reports the average number of lanes of our wavefront that are active over all VALU instructions, or thread “convergence” (i.e., 1 - divergence).
Note
We note here that:
The act of evaluating a vector conditional in this example typically triggers VALU operations, contributing to why the VALU Active Threads metric is not identically one.
This metric is a time (cycle) averaged value, and thus contains an implicit dependence on the duration of various VALU instructions.
Nonetheless, this metric serves as a useful measure of thread-convergence.
Finally, we note that our branch utilization (11.2.5) has increased slightly from our baseline, as we now have a branch (checking the value of threadIdx.x).
LDS Examples
For this example, we consider the LDS sample distributed as a part of Omniperf. This code contains two kernels to explore how both LDS bandwidth and bank conflicts are calculated in Omniperf.
This example was compiled and run on an MI250 accelerator using ROCm v5.6.0, and Omniperf v2.0.0.
$ hipcc -O3 lds.hip -o lds
Finally, we generate our omniperf profile as:
$ omniperf profile -n lds --no-roof -- ./lds
LDS Bandwidth
To explore our ‘theoretical LDS bandwidth’ metric, we use a simple kernel:
constexpr unsigned max_threads = 256;
__global__ void load(int* out, int flag) {
  __shared__ int array[max_threads];
  int index = threadIdx.x;
  // fake a store to the LDS array to avoid unwanted behavior
  if (flag)
    array[max_threads - index] = index;
  __syncthreads();
  int x = array[index];
  if (x == int(-1234567))
    out[threadIdx.x] = x;
}
Here we:
Create an array of 256 integers in LDS
Fake a write to the LDS using the
flagvariable (always set to zero on the host) to avoid dead-code eliminationRead a single integer per work-item from
threadIdx.xof the LDS arrayIf the integer is equal to a magic number (always false), write the value out to global memory to again, avoid dead-code elimination
Finally, we launch this kernel repeatedly, varying the number of threads in our workgroup:
void bandwidth_demo(int N) {
  for (int i = 1; i <= N; ++i)
    load<<<1,i>>>(nullptr, 0);
  hipDeviceSynchronize();
}
Next, let’s analyze the first of our bandwidth kernel dispatches:
$ omniperf analyze -p workloads/lds/mi200/ -b 12.2.1 --dispatch 0 -n per_kernel
<...>
12. Local Data Share (LDS)
12.2 LDS Stats
╒═════════╤═══════════════════════╤════════╤════════╤════════╤══════════════════╕
│ Index   │ Metric                │    Avg │    Min │    Max │ Unit             │
╞═════════╪═══════════════════════╪════════╪════════╪════════╪══════════════════╡
│ 12.2.1  │ Theoretical Bandwidth │ 256.00 │ 256.00 │ 256.00 │ Bytes per kernel │
╘═════════╧═══════════════════════╧════════╧════════╧════════╧══════════════════╛
Here we see that our Theoretical Bandwidth metric (12.2.1) is reporting 256 Bytes were loaded even though we launched a single work-item workgroup, and thus only loaded a single integer from LDS. Why is this?
Recall our definition of this metric:
Indicates the maximum amount of bytes that could have been loaded from/stored to/atomically updated in the LDS per normalization-unit.
Here we see that this instruction could have loaded up to 256 bytes of data (4 bytes for each work-item in the wavefront), and therefore this is the expected value for this metric in Omniperf, hence why this metric is named the “theoretical” bandwidth.
To further illustrate this point we plot the relationship of the theoretical bandwidth metric (12.2.1) as compared to the effective (or achieved) bandwidth of this kernel, varying the number of work-items launched from 1 to 256:

Comparison of effective bandwidth versus the theoretical bandwidth metric in Omniperf for our simple example.
Here we see that the theoretical bandwidth metric follows a step-function. It increases only when another wavefront issues an LDS instruction for up to 256 bytes of data. Such increases are marked in the plot using dashed lines. In contrast, the effective bandwidth increases linearly, by 4 bytes, with the number of work-items in the kernel, N.
Bank Conflicts
Next we explore bank conflicts using a slight modification of our bandwidth kernel:
constexpr unsigned nbanks = 32;
__global__ void conflicts(int* out, int flag) {
  constexpr unsigned nelements = nbanks * max_threads;
  __shared__ int array[nelements];
  // each thread reads from the same bank
  int index = threadIdx.x * nbanks;
  // fake a store to the LDS array to avoid unwanted behavior
  if (flag)
    array[max_threads - index] = index;
  __syncthreads();
  int x = array[index];
  if (x == int(-1234567))
    out[threadIdx.x] = x;
}
Here we:
Allocate an LDS array of size \(32*256*4{B}=32{KiB}\)
Fake a write to the LDS using the
flagvariable (always set to zero on the host) to avoid dead-code eliminationRead a single integer per work-item from index
threadIdx.x * nbanksof the LDS arrayIf the integer is equal to a magic number (always false), write the value out to global memory to, again, avoid dead-code elimination.
On the host, we again repeatedly launch this kernel, varying the number of work-items:
void conflicts_demo(int N) {
  for (int i = 1; i <= N; ++i)
    conflicts<<<1,i>>>(nullptr, 0);
  hipDeviceSynchronize();
}
Analyzing our first conflicts kernel (i.e., a single work-item), we see:
$ omniperf analyze -p workloads/lds/mi200/ -b 12.2.4 12.2.6 --dispatch 256 -n per_kernel
<...>
--------------------------------------------------------------------------------
12. Local Data Share (LDS)
12.2 LDS Stats
╒═════════╤════════════════╤═══════╤═══════╤═══════╤═══════════════════╕
│ Index   │ Metric         │   Avg │   Min │   Max │ Unit              │
╞═════════╪════════════════╪═══════╪═══════╪═══════╪═══════════════════╡
│ 12.2.4  │ Index Accesses │  2.00 │  2.00 │  2.00 │ Cycles per kernel │
├─────────┼────────────────┼───────┼───────┼───────┼───────────────────┤
│ 12.2.6  │ Bank Conflict  │  0.00 │  0.00 │  0.00 │ Cycles per kernel │
╘═════════╧════════════════╧═══════╧═══════╧═══════╧═══════════════════╛
In our previous example, we showed how a load from a single work-item is considered to have a theoretical bandwidth of 256B. Recall, the LDS can load up to \(128B\) per cycle (i.e, 32 banks x 4B / bank / cycle). Hence, we see that loading an 4B integer spends two cycles accessing the LDS (\(2\ {cycle} = (256B) / (128\ B/{cycle})\)).
Looking at the next conflicts dispatch (i.e., two work-items) yields:
$ omniperf analyze -p workloads/lds/mi200/ -b 12.2.4 12.2.6 --dispatch 257 -n per_kernel
<...>
--------------------------------------------------------------------------------
12. Local Data Share (LDS)
12.2 LDS Stats
╒═════════╤════════════════╤═══════╤═══════╤═══════╤═══════════════════╕
│ Index   │ Metric         │   Avg │   Min │   Max │ Unit              │
╞═════════╪════════════════╪═══════╪═══════╪═══════╪═══════════════════╡
│ 12.2.4  │ Index Accesses │  3.00 │  3.00 │  3.00 │ Cycles per kernel │
├─────────┼────────────────┼───────┼───────┼───────┼───────────────────┤
│ 12.2.6  │ Bank Conflict  │  1.00 │  1.00 │  1.00 │ Cycles per kernel │
╘═════════╧════════════════╧═══════╧═══════╧═══════╧═══════════════════╛
Here we see a bank conflict! What happened?
Recall that the index for each thread was calculated as:
int index = threadIdx.x * nbanks;
Or, precisely 32 elements, and each element is 4B wide (for a standard integer). That is, each thread strides back to the same bank in the LDS, such that each work-item we add to the dispatch results in another bank conflict!
Recalling our discussion of bank conflicts in our LDS description:
A bank conflict occurs when two (or more) work-items in a wavefront want to read, write, or atomically update different addresses that map to the same bank in the same cycle. In this case, the conflict detection hardware will determined a new schedule such that the access is split into multiple cycles with no conflicts in any single cycle.
Here we see the conflict resolution hardware in action! Because we have engineered our kernel to generate conflicts, we expect our bank conflict metric to scale linearly with the number of work-items:

Comparison of LDS conflict cycles versus access cycles for our simple example.
Here we show the comparison of the Index Accesses (12.2.4), to the Bank Conflicts (12.2.6) for the first 20 kernel invocations. We see that each grows linearly, and there is a constant gap of 2 cycles between them (i.e., the first access is never considered a conflict).
Finally, we can use these two metrics to derive the Bank Conflict Rate (12.1.4). Since within an Index Access we have 32 banks that may need to be updated, we use:
Plotting this, we see:

LDS Bank Conflict rate for our simple example.
The bank conflict rate linearly increases with the number of work-items within a wavefront that are active, approaching 100%, but never quite reaching it.
Occupancy Limiters Example
In this example, we will investigate the use of the resource allocation panel in the Workgroup Manager’s metrics section to determine occupancy limiters. This code contains several kernels to explore how both various kernel resources impact achieved occupancy, and how this is reported in Omniperf.
This example was compiled and run on a MI250 accelerator using ROCm v5.6.0, and Omniperf v2.0.0:
$ hipcc -O3 occupancy.hip -o occupancy --save-temps
We have again included the --save-temps flag to get the corresponding assembly.
Finally, we generate our Omniperf profile as:
$ omniperf profile -n occupancy --no-roof -- ./occupancy
Design note
For our occupancy test, we need to create a kernel that is resource heavy, in various ways. For this purpose, we use the following (somewhat funny-looking) kernel:
constexpr int bound = 16;
__launch_bounds__(256)
__global__ void vgprbound(int N, double* ptr) {
    double intermediates[bound];
    for (int i = 0 ; i < bound; ++i) intermediates[i] = N * threadIdx.x;
    double x = ptr[threadIdx.x];
    for (int i = 0; i < 100; ++i) {
        x += sin(pow(__shfl(x, i % warpSize) * intermediates[(i - 1) % bound], intermediates[i % bound]));
        intermediates[i % bound] = x;
    }
    if (x == N) ptr[threadIdx.x] = x;
}
Here we try to use as many VGPRs as possible, to this end:
We create a small array of double precision floats, that we size to try to fit into registers (i.e.,
bound, this may need to be tuned depending on the ROCm version).We specify
__launch_bounds___(256)to increase the number of VPGRs available to the kernel (by limiting the number of wavefronts that can be resident on a CU).Write a unique non-compile time constant to each element of the array.
Repeatedly permute and call relatively expensive math functions on our array elements.
Keep the compiler from optimizing out any operations by faking a write to the
ptrbased on a run-time conditional.
This yields a total of 122 VGPRs, but it is expected this number will depend on the exact ROCm/compiler version.
        .size   _Z9vgprboundiPd, .Lfunc_end1-_Z9vgprboundiPd
                                        ; -- End function
        .section        .AMDGPU.csdata
; Kernel info:
; codeLenInByte = 4732
; NumSgprs: 68
; NumVgprs: 122
; NumAgprs: 0
; <...>
; AccumOffset: 124
We will use various permutations of this kernel to limit occupancy, and more importantly for the purposes of this example, demonstrate how this is reported in Omniperf.
VGPR Limited
For our first test, we use the vgprbound kernel discussed in the design note.
After profiling, we run the analyze step on this kernel:
$ omniperf analyze -p workloads/occupancy/mi200/ -b 2.1.15 6.2 7.1.5 7.1.6 7.1.7 --dispatch 1
<...>
--------------------------------------------------------------------------------
0. Top Stat
╒════╤═════════════════════════╤═════════╤══════════════╤══════════════╤══════════════╤════════╕
│    │ KernelName              │   Count │      Sum(ns) │     Mean(ns) │   Median(ns) │    Pct │
╞════╪═════════════════════════╪═════════╪══════════════╪══════════════╪══════════════╪════════╡
│  0 │ vgprbound(int, double*) │    1.00 │ 923093822.50 │ 923093822.50 │ 923093822.50 │ 100.00 │
╘════╧═════════════════════════╧═════════╧══════════════╧══════════════╧══════════════╧════════╛


--------------------------------------------------------------------------------
2. System Speed-of-Light
2.1 Speed-of-Light
╒═════════╤═════════════════════╤═════════╤════════════╤═════════╤═══════════════╕
│ Index   │ Metric              │     Avg │ Unit       │    Peak │   Pct of Peak │
╞═════════╪═════════════════════╪═════════╪════════════╪═════════╪═══════════════╡
│ 2.1.15  │ Wavefront Occupancy │ 1661.24 │ Wavefronts │ 3328.00 │         49.92 │
╘═════════╧═════════════════════╧═════════╧════════════╧═════════╧═══════════════╛


--------------------------------------------------------------------------------
6. Workgroup Manager (SPI)
6.2 Workgroup Manager - Resource Allocation
╒═════════╤════════════════════════════════════════╤═══════╤═══════╤═══════╤════════╕
│ Index   │ Metric                                 │   Avg │   Min │   Max │ Unit   │
╞═════════╪════════════════════════════════════════╪═══════╪═══════╪═══════╪════════╡
│ 6.2.0   │ Not-scheduled Rate (Workgroup Manager) │  0.64 │  0.64 │  0.64 │ Pct    │
├─────────┼────────────────────────────────────────┼───────┼───────┼───────┼────────┤
│ 6.2.1   │ Not-scheduled Rate (Scheduler-Pipe)    │ 24.94 │ 24.94 │ 24.94 │ Pct    │
├─────────┼────────────────────────────────────────┼───────┼───────┼───────┼────────┤
│ 6.2.2   │ Scheduler-Pipe Stall Rate              │ 24.49 │ 24.49 │ 24.49 │ Pct    │
├─────────┼────────────────────────────────────────┼───────┼───────┼───────┼────────┤
│ 6.2.3   │ Scratch Stall Rate                     │  0.00 │  0.00 │  0.00 │ Pct    │
├─────────┼────────────────────────────────────────┼───────┼───────┼───────┼────────┤
│ 6.2.4   │ Insufficient SIMD Waveslots            │  0.00 │  0.00 │  0.00 │ Pct    │
├─────────┼────────────────────────────────────────┼───────┼───────┼───────┼────────┤
│ 6.2.5   │ Insufficient SIMD VGPRs                │ 94.90 │ 94.90 │ 94.90 │ Pct    │
├─────────┼────────────────────────────────────────┼───────┼───────┼───────┼────────┤
│ 6.2.6   │ Insufficient SIMD SGPRs                │  0.00 │  0.00 │  0.00 │ Pct    │
├─────────┼────────────────────────────────────────┼───────┼───────┼───────┼────────┤
│ 6.2.7   │ Insufficient CU LDS                    │  0.00 │  0.00 │  0.00 │ Pct    │
├─────────┼────────────────────────────────────────┼───────┼───────┼───────┼────────┤
│ 6.2.8   │ Insufficient CU Barriers               │  0.00 │  0.00 │  0.00 │ Pct    │
├─────────┼────────────────────────────────────────┼───────┼───────┼───────┼────────┤
│ 6.2.9   │ Reached CU Workgroup Limit             │  0.00 │  0.00 │  0.00 │ Pct    │
├─────────┼────────────────────────────────────────┼───────┼───────┼───────┼────────┤
│ 6.2.10  │ Reached CU Wavefront Limit             │  0.00 │  0.00 │  0.00 │ Pct    │
╘═════════╧════════════════════════════════════════╧═══════╧═══════╧═══════╧════════╛


--------------------------------------------------------------------------------
7. Wavefront
7.1 Wavefront Launch Stats
╒═════════╤══════════╤════════╤════════╤════════╤═══════════╕
│ Index   │ Metric   │    Avg │    Min │    Max │ Unit      │
╞═════════╪══════════╪════════╪════════╪════════╪═══════════╡
│ 7.1.5   │ VGPRs    │ 124.00 │ 124.00 │ 124.00 │ Registers │
├─────────┼──────────┼────────┼────────┼────────┼───────────┤
│ 7.1.6   │ AGPRs    │   4.00 │   4.00 │   4.00 │ Registers │
├─────────┼──────────┼────────┼────────┼────────┼───────────┤
│ 7.1.7   │ SGPRs    │  80.00 │  80.00 │  80.00 │ Registers │
╘═════════╧══════════╧════════╧════════╧════════╧═══════════╛
Here we see that the kernel indeed does use around (but not exactly) 122 VGPRs, with the difference due to granularity of VGPR allocations.
In addition, we see that we have allocated 4 “AGPRs”.
We note that on current CDNA2 accelerators, the AccumOffset field of the assembly metadata:
; AccumOffset: 124
denotes the divide between VGPRs and AGPRs.
Next, we examine our wavefront occupancy (2.1.15), and see that we are reaching only \(\sim50\%\) of peak occupancy. As a result, we see that:
We are not scheduling workgroups \(\sim25\%\) of total scheduler-pipe cycles (6.2.1); recall from the discussion of the Workgroup manager, 25% is the maximum.
The scheduler-pipe is stalled (6.2.2) from scheduling workgroups due to resource constraints for the same \(\sim25\%\) of the time.
And finally, \(\sim91\%\) of those stalls are due to a lack of SIMDs with the appropriate number of VGPRs available (6.2.5).
That is, the reason we can’t reach full occupancy is due to our VGPR usage, as expected!
LDS Limited
To examine an LDS limited example, we must change our kernel slightly:
constexpr size_t fully_allocate_lds = 64ul * 1024ul / sizeof(double);
__launch_bounds__(256)
__global__ void ldsbound(int N, double* ptr) {
    __shared__ double intermediates[fully_allocate_lds];
    for (int i = threadIdx.x ; i < fully_allocate_lds; i += blockDim.x) intermediates[i] = N * threadIdx.x;
    __syncthreads();
    double x = ptr[threadIdx.x];
    for (int i = threadIdx.x; i < fully_allocate_lds; i += blockDim.x) {
        x += sin(pow(__shfl(x, i % warpSize) * intermediates[(i - 1) % fully_allocate_lds], intermediates[i % fully_allocate_lds]));
        __syncthreads();
        intermediates[i % fully_allocate_lds] = x;
    }
    if (x == N) ptr[threadIdx.x] = x;
}
where we now:
allocate an 64 KiB LDS array per workgroup, and
use our allocated LDS array instead of a register array
Analyzing this:
$ omniperf analyze -p workloads/occupancy/mi200/ -b 2.1.15 6.2 7.1.5 7.1.6 7.1.7 7.1.8 --dispatch 3
<...>
--------------------------------------------------------------------------------
2. System Speed-of-Light
2.1 Speed-of-Light
╒═════════╤═════════════════════╤════════╤════════════╤═════════╤═══════════════╕
│ Index   │ Metric              │    Avg │ Unit       │    Peak │   Pct of Peak │
╞═════════╪═════════════════════╪════════╪════════════╪═════════╪═══════════════╡
│ 2.1.15  │ Wavefront Occupancy │ 415.52 │ Wavefronts │ 3328.00 │         12.49 │
╘═════════╧═════════════════════╧════════╧════════════╧═════════╧═══════════════╛


--------------------------------------------------------------------------------
6. Workgroup Manager (SPI)
6.2 Workgroup Manager - Resource Allocation
╒═════════╤════════════════════════════════════════╤═══════╤═══════╤═══════╤════════╕
│ Index   │ Metric                                 │   Avg │   Min │   Max │ Unit   │
╞═════════╪════════════════════════════════════════╪═══════╪═══════╪═══════╪════════╡
│ 6.2.0   │ Not-scheduled Rate (Workgroup Manager) │  0.13 │  0.13 │  0.13 │ Pct    │
├─────────┼────────────────────────────────────────┼───────┼───────┼───────┼────────┤
│ 6.2.1   │ Not-scheduled Rate (Scheduler-Pipe)    │ 24.87 │ 24.87 │ 24.87 │ Pct    │
├─────────┼────────────────────────────────────────┼───────┼───────┼───────┼────────┤
│ 6.2.2   │ Scheduler-Pipe Stall Rate              │ 24.84 │ 24.84 │ 24.84 │ Pct    │
├─────────┼────────────────────────────────────────┼───────┼───────┼───────┼────────┤
│ 6.2.3   │ Scratch Stall Rate                     │  0.00 │  0.00 │  0.00 │ Pct    │
├─────────┼────────────────────────────────────────┼───────┼───────┼───────┼────────┤
│ 6.2.4   │ Insufficient SIMD Waveslots            │  0.00 │  0.00 │  0.00 │ Pct    │
├─────────┼────────────────────────────────────────┼───────┼───────┼───────┼────────┤
│ 6.2.5   │ Insufficient SIMD VGPRs                │  0.00 │  0.00 │  0.00 │ Pct    │
├─────────┼────────────────────────────────────────┼───────┼───────┼───────┼────────┤
│ 6.2.6   │ Insufficient SIMD SGPRs                │  0.00 │  0.00 │  0.00 │ Pct    │
├─────────┼────────────────────────────────────────┼───────┼───────┼───────┼────────┤
│ 6.2.7   │ Insufficient CU LDS                    │ 96.47 │ 96.47 │ 96.47 │ Pct    │
├─────────┼────────────────────────────────────────┼───────┼───────┼───────┼────────┤
│ 6.2.8   │ Insufficient CU Barriers               │  0.00 │  0.00 │  0.00 │ Pct    │
├─────────┼────────────────────────────────────────┼───────┼───────┼───────┼────────┤
│ 6.2.9   │ Reached CU Workgroup Limit             │  0.00 │  0.00 │  0.00 │ Pct    │
├─────────┼────────────────────────────────────────┼───────┼───────┼───────┼────────┤
│ 6.2.10  │ Reached CU Wavefront Limit             │  0.00 │  0.00 │  0.00 │ Pct    │
╘═════════╧════════════════════════════════════════╧═══════╧═══════╧═══════╧════════╛


--------------------------------------------------------------------------------
7. Wavefront
7.1 Wavefront Launch Stats
╒═════════╤════════════════╤══════════╤══════════╤══════════╤═══════════╕
│ Index   │ Metric         │      Avg │      Min │      Max │ Unit      │
╞═════════╪════════════════╪══════════╪══════════╪══════════╪═══════════╡
│ 7.1.5   │ VGPRs          │    96.00 │    96.00 │    96.00 │ Registers │
├─────────┼────────────────┼──────────┼──────────┼──────────┼───────────┤
│ 7.1.6   │ AGPRs          │     0.00 │     0.00 │     0.00 │ Registers │
├─────────┼────────────────┼──────────┼──────────┼──────────┼───────────┤
│ 7.1.7   │ SGPRs          │    80.00 │    80.00 │    80.00 │ Registers │
├─────────┼────────────────┼──────────┼──────────┼──────────┼───────────┤
│ 7.1.8   │ LDS Allocation │ 65536.00 │ 65536.00 │ 65536.00 │ Bytes     │
╘═════════╧════════════════╧══════════╧══════════╧══════════╧═══════════╛
We see that our VGPR allocation has gone down to 96 registers, but now we see our 64KiB LDS allocation (7.1.8). In addition, we see a similar non-schedule rate (6.2.1) and stall rate (6.2.2) as in our VGPR example. However, our occupancy limiter has now shifted from VGPRs (6.2.5) to LDS (6.2.7).
We note that although we see the around the same scheduler/stall rates (with our LDS limiter), our wave occupancy (2.1.15) is significantly lower (\(\sim12\%\))! This is important to remember: the occupancy limiter metrics in the resource allocation section tell you what the limiter was, but not how much the occupancy was limited. These metrics should always be analyzed in concert with the wavefront occupancy metric!
SGPR Limited
Finally, we modify our kernel once more to make it limited by SGPRs:
constexpr int sgprlim = 1;
__launch_bounds__(1024, 8)
__global__ void sgprbound(int N, double* ptr) {
    double intermediates[sgprlim];
    for (int i = 0 ; i < sgprlim; ++i) intermediates[i] = i;
    double x = ptr[0];
    #pragma unroll 1
    for (int i = 0; i < 100; ++i) {
        x += sin(pow(intermediates[(i - 1) % sgprlim], intermediates[i % sgprlim]));
        intermediates[i % sgprlim] = x;
    }
    if (x == N) ptr[0] = x;
}
The major changes here are to:
make as much as possible provably uniform across the wave (notice the lack of
threadIdx.xin theintermediatesinitialization and elsewhere),addition of
__launch_bounds__(1024, 8), which reduces our maximum VGPRs to 64 (such that 8 waves can fit per SIMD), but causes some register spills (i.e., Scratch usage), andlower the
bound(here we usesgprlim) of the array to reduce VGPR/Scratch usage
This results in the following assembly metadata for this kernel:
        .size   _Z9sgprboundiPd, .Lfunc_end3-_Z9sgprboundiPd
                                        ; -- End function
        .section        .AMDGPU.csdata
; Kernel info:
; codeLenInByte = 4872
; NumSgprs: 76
; NumVgprs: 64
; NumAgprs: 0
; TotalNumVgprs: 64
; ScratchSize: 60
; <...>
; AccumOffset: 64
; Occupancy: 8
Analyzing this workload yields:
$ omniperf analyze -p workloads/occupancy/mi200/ -b 2.1.15 6.2 7.1.5 7.1.6 7.1.7 7.1.8 7.1.9 --dispatch 5
<...>
--------------------------------------------------------------------------------
0. Top Stat
╒════╤═════════════════════════╤═════════╤══════════════╤══════════════╤══════════════╤════════╕
│    │ KernelName              │   Count │      Sum(ns) │     Mean(ns) │   Median(ns) │    Pct │
╞════╪═════════════════════════╪═════════╪══════════════╪══════════════╪══════════════╪════════╡
│  0 │ sgprbound(int, double*) │    1.00 │ 782069812.00 │ 782069812.00 │ 782069812.00 │ 100.00 │
╘════╧═════════════════════════╧═════════╧══════════════╧══════════════╧══════════════╧════════╛


--------------------------------------------------------------------------------
2. System Speed-of-Light
2.1 Speed-of-Light
╒═════════╤═════════════════════╤═════════╤════════════╤═════════╤═══════════════╕
│ Index   │ Metric              │     Avg │ Unit       │    Peak │   Pct of Peak │
╞═════════╪═════════════════════╪═════════╪════════════╪═════════╪═══════════════╡
│ 2.1.15  │ Wavefront Occupancy │ 3291.76 │ Wavefronts │ 3328.00 │         98.91 │
╘═════════╧═════════════════════╧═════════╧════════════╧═════════╧═══════════════╛


--------------------------------------------------------------------------------
6. Workgroup Manager (SPI)
6.2 Workgroup Manager - Resource Allocation
╒═════════╤════════════════════════════════════════╤═══════╤═══════╤═══════╤════════╕
│ Index   │ Metric                                 │   Avg │   Min │   Max │ Unit   │
╞═════════╪════════════════════════════════════════╪═══════╪═══════╪═══════╪════════╡
│ 6.2.0   │ Not-scheduled Rate (Workgroup Manager) │  7.72 │  7.72 │  7.72 │ Pct    │
├─────────┼────────────────────────────────────────┼───────┼───────┼───────┼────────┤
│ 6.2.1   │ Not-scheduled Rate (Scheduler-Pipe)    │ 15.17 │ 15.17 │ 15.17 │ Pct    │
├─────────┼────────────────────────────────────────┼───────┼───────┼───────┼────────┤
│ 6.2.2   │ Scheduler-Pipe Stall Rate              │  7.38 │  7.38 │  7.38 │ Pct    │
├─────────┼────────────────────────────────────────┼───────┼───────┼───────┼────────┤
│ 6.2.3   │ Scratch Stall Rate                     │ 39.76 │ 39.76 │ 39.76 │ Pct    │
├─────────┼────────────────────────────────────────┼───────┼───────┼───────┼────────┤
│ 6.2.4   │ Insufficient SIMD Waveslots            │ 26.32 │ 26.32 │ 26.32 │ Pct    │
├─────────┼────────────────────────────────────────┼───────┼───────┼───────┼────────┤
│ 6.2.5   │ Insufficient SIMD VGPRs                │ 26.32 │ 26.32 │ 26.32 │ Pct    │
├─────────┼────────────────────────────────────────┼───────┼───────┼───────┼────────┤
│ 6.2.6   │ Insufficient SIMD SGPRs                │ 25.52 │ 25.52 │ 25.52 │ Pct    │
├─────────┼────────────────────────────────────────┼───────┼───────┼───────┼────────┤
│ 6.2.7   │ Insufficient CU LDS                    │  0.00 │  0.00 │  0.00 │ Pct    │
├─────────┼────────────────────────────────────────┼───────┼───────┼───────┼────────┤
│ 6.2.8   │ Insufficient CU Barriers               │  0.00 │  0.00 │  0.00 │ Pct    │
├─────────┼────────────────────────────────────────┼───────┼───────┼───────┼────────┤
│ 6.2.9   │ Reached CU Workgroup Limit             │  0.00 │  0.00 │  0.00 │ Pct    │
├─────────┼────────────────────────────────────────┼───────┼───────┼───────┼────────┤
│ 6.2.10  │ Reached CU Wavefront Limit             │  0.00 │  0.00 │  0.00 │ Pct    │
╘═════════╧════════════════════════════════════════╧═══════╧═══════╧═══════╧════════╛


--------------------------------------------------------------------------------
7. Wavefront
7.1 Wavefront Launch Stats
╒═════════╤════════════════════╤═══════╤═══════╤═══════╤════════════════╕
│ Index   │ Metric             │   Avg │   Min │   Max │ Unit           │
╞═════════╪════════════════════╪═══════╪═══════╪═══════╪════════════════╡
│ 7.1.5   │ VGPRs              │ 64.00 │ 64.00 │ 64.00 │ Registers      │
├─────────┼────────────────────┼───────┼───────┼───────┼────────────────┤
│ 7.1.6   │ AGPRs              │  0.00 │  0.00 │  0.00 │ Registers      │
├─────────┼────────────────────┼───────┼───────┼───────┼────────────────┤
│ 7.1.7   │ SGPRs              │ 80.00 │ 80.00 │ 80.00 │ Registers      │
├─────────┼────────────────────┼───────┼───────┼───────┼────────────────┤
│ 7.1.8   │ LDS Allocation     │  0.00 │  0.00 │  0.00 │ Bytes          │
├─────────┼────────────────────┼───────┼───────┼───────┼────────────────┤
│ 7.1.9   │ Scratch Allocation │ 60.00 │ 60.00 │ 60.00 │ Bytes/workitem │
╘═════════╧════════════════════╧═══════╧═══════╧═══════╧════════════════╛
Here we see that our wavefront launch stats (7.1) have changed to reflect the metadata seen in the --save-temps output.
Of particular interest, we see:
The SGPR allocation (7.1.7) is 80 registers, slightly more than the 76 requested by the compiler due to allocation granularity, and
We have a ‘scratch’ i.e., private memory, allocation of 60 bytes per work-item
Analyzing the resource allocation block (6.2) we now see that for the first time, the ‘Not-scheduled Rate (Workgroup Manager)’ metric (6.2.0) has become non-zero. This is because the workgroup manager is responsible for management of scratch, which we see also contributes to our occupancy limiters in the ‘Scratch Stall Rate’ (6.2.3). We note that the sum of the workgroup manager not-scheduled rate and the scheduler-pipe non-scheduled rate is still \(\sim25\%\), as in our previous examples
Next, we see that the scheduler-pipe stall rate (6.2.2), i.e., how often we could not schedule a workgroup to a CU was only about \(\sim8\%\). This hints that perhaps, our kernel is not particularly occupancy limited by resources, and indeed checking the wave occupancy metric (2.1.15) shows that this kernel is reaching nearly 99% occupancy!
Finally, we inspect the occupancy limiter metrics and see a roughly even split between waveslots (6.2.4), VGPRs (6.2.5), and SGPRs (6.2.6) along with the scratch stalls (6.2.3) previously mentioned.
This is yet another reminder to view occupancy holistically. While these metrics tell you why a workgroup cannot be scheduled, they do not tell you what your occupancy was (consult wavefront occupancy) nor whether increasing occupancy will be beneficial to performance.